


“Peak oil”—the notion that the depletion of accessible petroleum deposits would soon lead to declining global oil output and an upward trend in prices—was widely debated in the late 1990s and early 2000s. Proponents of the peak supply thesis turned out to be wrong, given the introduction of fracking and other new extraction methods. Now the notion of peak oil is back, but in reverse form, with global demand set to flatten and then fade amid growing use of EVs and other low-carbon technologies. The arrival of “peak demand” would turn global oil markets into a zero-sum game: Supply growth in one region or field would simply push down prices, driving out higher-cost producers elsewhere. A key question is how U.S. producers would adapt to the new market environment.
The Peak Oil Debate
U.S. crude oil output fell at an average annual rate of 2 percent during the 1990s. In 1998, a Scientific American article, “The End of Cheap Oil,” predicted that the decline would extend to global production by 2010. The argument was based on the tendency for a region’s rate of extraction to taper off after half of conventional reserves had been extracted. The implication was that global economic growth would soon face a major headwind from higher oil prices.
In early 2012, a Nature article (“Oil’s Tipping Point Has Passed”) revisited the peak oil argument, noting that oil production gains since 2005 had been modest and prices had moved much higher. Indeed, real oil prices (in today’s dollars) averaged $140/barrel (bl) in 2008, and after a brief dip during the global financial crisis, moved past $150/bl in 2011. The authors’ verdict: “Production is now ‘inelastic,’ unable to respond to rising demand.” In short, peak oil was around the corner.
Global Oil Production Stalled in 2005 despite High Oil Prices
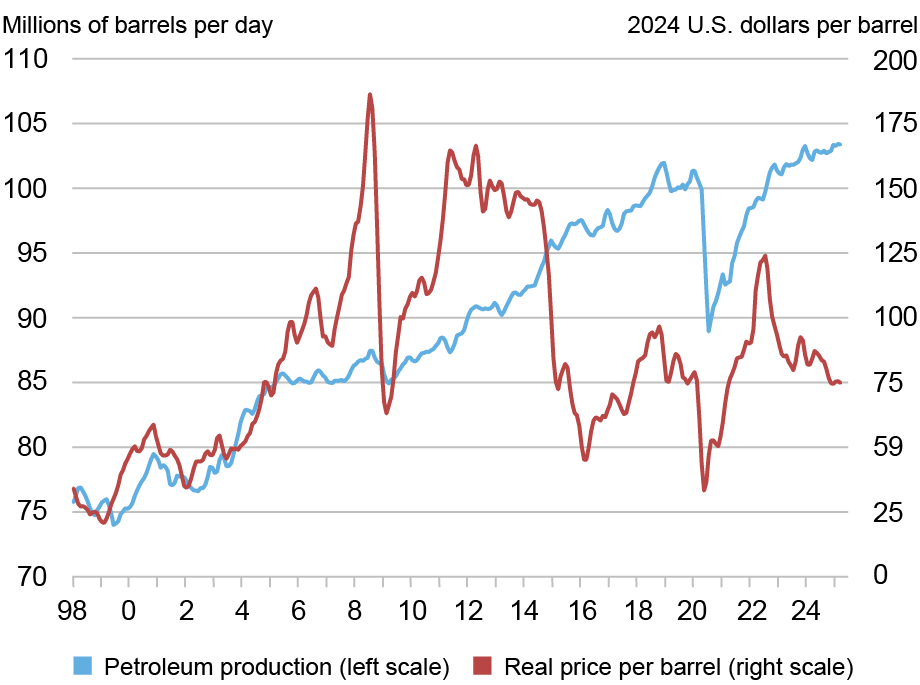
Notes: Data are three-month moving averages. Nominal oil prices (Brent) are deflated by the U.S. CPI, with the CPI value for 2024 set at 1.
What the authors did not fully appreciate was that the U.S. fracking revolution was already underway.
Enter the Fracking Revolution
Fracking (short for hydraulic fracturing) allows oil producers to access deposits embedded in rock formations—so called “tight oil.” Fracking also allows expanded access to “wet gas” deposits— deposits that can be processed into natural gas liquids (NGLs) such as ethane, propane, and butane. This technology is typically more expensive than conventional drilling, and the move to higher prices after the early 2000s helped to make it viable.
The success of the new suite of technologies was striking. After falling to a fifty-year low in the mid-2000s, U.S. oil production increased by roughly 0.5 million barrels per day (mb/d) in 2009, 2010, and 2011. But it was in 2012 that U.S. oil production really took off. From 2012 to 2019, U.S. production increased by 8.4 mb/d—an average of 1.2 mb/d per year (see the chart below). Production of crude oil from conventional sources increased only marginally.
U.S. Production Accounts for Essentially All the Gains in Global Extraction since 2012
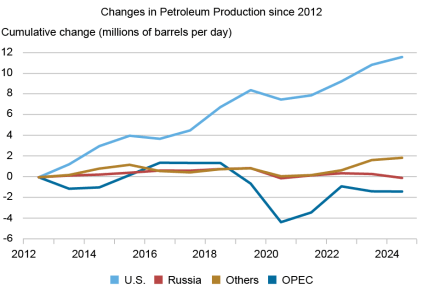
Notes: Petroleum, as defined here, includes crude oil, natural gas liquids, processing gains, and biofuels.
U.S. production gains are all the more notable given developments worldwide, with production elsewhere increasing by only 1.1 mb/d over the period.
The upward trend in U.S. production continued despite the sharp and largely sustained drop in oil prices that took hold in late 2014. The price shock forced dramatic technology-driven productivity gains that allowed U.S. production growth to continue to move higher. According to data from the Bureau of Labor Statistics (BLS), total factor productivity—the output that can be produced given fixed inputs—increased by 52 percent in the oil and gas extraction sector from 2012 to 2019.
Recent global production gains have been even more one-sided. U.S. production has increased by 3.2 mb/d since 2019. Production in the rest of the world combined has fallen by 0.7 mb/d, with declines in both Russia and the OPEC countries.
From Peak Supply to Peak Demand
Peak oil theorists argued that scarcity of accessible resources would drive a decline in oil supply. Instead, there are signs that peak oil will be driven by the demand side of the market.
The chart below shows cumulative changes in global liquid fuel consumption since 2012, broken down into the United States, OECD countries apart from the U.S. (essentially, other high-income countries), China, and the rest of the world.
Emerging Economies Account for All Recent Oil Demand Growth

Notes: Petroleum, as defined here, includes crude oil, natural gas liquids, processing gains, and biofuels.
U.S. consumption grew by 2 mb/d over 2012–19 but fell back during the pandemic. Since 2021, consumption has flatlined at just below its pre-pandemic level. Consumption in OECD countries outside the United State was stagnating even prior to the pandemic. Since then, consumption has stayed about 2 mb/d below its earlier level. All told, oil consumption in high-income countries has not increased since 2012.
The story is different in emerging market economies (EMEs). Oil consumption in China rose by almost 4 mb/d from 2012 to 2019, and by roughly another 2 mb/d from 2019 to 2024. Consumption in emerging economies outside China saw similar gains over the two periods, a large dip during the pandemic notwithstanding. But there are signs that EME demand growth is slowing. Chinese consumption grew at a 4.8 percent annual pace over 2012-19, but at only a 3.1 percent pace over 2019-24, with only a modest gain in 2024. Consumption in other EMEs grew at a 1.7 percent pace over 2012-19, but has grown at just a 1.0 percent pace since then.
How do we know that the slowing trend reflects weak demand growth rather than constraints on supply? Prices hold the key. Real oil prices today are lower than in 2019. They would be rising instead if supply were straining to keep up with demand. OPEC’s high spare capacity, estimated by the U.S. Energy Information Administration (EIA) to be around 4 mb/d, indicates that more oil is available if the market wants it.
Some leading international and industry groups believe that oil consumption is set to peak. The International Energy Agency’s (IEA) baseline scenario has global oil consumption peaking by 2030 and falling about 2 percent below current levels by 2035. British Petroleum’s (BP) baseline also has global consumption flattening around 2030 and falling by 2035.
IEA and BP identify the electrification of transportation as the main driver of the projected peak in oil consumption. (Alternative energy generation and gains in energy efficiency are also important.) Sales of electric vehicles (battery-powered and plug-in hybrids) were negligible before the pandemic. By 2024, however, sales had reached 10 million units in China (44 percent of total sales), 3 million in Europe (23 percent), and 1.6 million in the U.S. (10 percent). The IEA’s Global EV Outlook projects that increased EV penetration will displace nearly 5 mb/d in oil consumption growth from 2024 to 2030. For comparison, global oil consumption increased by only 3 mb/d over the past six years.
To be sure, not all analysts expect oil demand to decline. The EIA’s “Reference Case” from its International Energy Outlook 2023 has global petroleum consumption growing at a steady annual pace of 0.7 percent through 2050. In essence, the EIA sees no structural break in oil use, with consumption rising in line with its historical connection with global GDP growth.
Global Oil Markets as a Zero-Sum Game
The arrival of peak demand would turn global oil markets into a zero-sum game. Supply growth in one region or field would simply push down prices by enough to cause offsetting declines elsewhere, with the highest-cost producers being pushed out of the market. This is not to suggest that oil prices will simply trend lower going forward. Geopolitical developments, OPEC supply decisions, and business cycle dynamics will continue to generate price swings. There is also a limit to how far prices can fall. Liquid fuel consumption will remain substantial in the years ahead under all plausible scenarios, and prices will have to remain high enough to induce the needed supply. But the basic point remains: A shift from rising consumption to flat or declining demand would weigh on prices.
How might U.S. producers fare in such a market environment? According to the Dallas Fed Energy Survey, U.S. firms need an average WTI oil price of $61 to $70 a barrel to profitably drill a new well, depending on the location. This range is close to analyst estimates of breakeven costs for foreign locations outside the Middle East, but more than twice as high as estimated breakeven costs in that region. Producers outside the Middle East could be vulnerable given future price declines.
Events following the oil price crash of late 2014 provide grounds for cautious optimism about the outlook for U.S. oil producers. U.S. production initially flat-lined, but then returned to growth, despite only a partial price recovery, because of the robust productivity gains mentioned above. (See the second chart for details.) Productivity growth in the U.S. oil sector has been strong in the post-pandemic period, even if not as strong as in that pre-pandemic period. If these gains can continue, the U.S. industry will be in a better position to weather future market shakeouts.

Matthew Higgins is an economic policy advisor in the Federal Reserve Bank of New York’s Research and Statistics Group.

Thomas Klitgaard is an economic policy advisor in the Federal Reserve Bank of New York’s Research and Statistics Group.
How to cite this post:
Matthew Higgins and Thomas Klitgaard, “Will Peak Demand Roil Global Oil Markets? ,” Federal Reserve Bank of New York Liberty Street Economics, April 14, 2025, https://libertystreeteconomics.newyorkfed.org/2025/04/will-peak-demand-roil-global-oil-markets/
BibTeX: View |


Disclaimer
The views expressed in this post are those of the author(s) and do not necessarily reflect the position of the Federal Reserve Bank of New York or the Federal Reserve System. Any errors or omissions are the responsibility of the author(s).
 RSS Feed
 Follow Liberty Street Economics