


In this post we provide a measure of “global” r* using data on short- and long-term yields and inflation for several countries with the approach developed in “Global Trends in Interest Rates” (Del Negro, Giannone, Giannoni, and Tambalotti). After declining significantly from the 1990s to before the COVID-19 pandemic, global r* has risen but remains well below its pre-1990s level. These conclusions are based on an econometric model called “trendy VAR” that extracts common trends across a multitude of variables. Specifically, the common trend in real rates across all the countries in the sample is what we call global r*. The post is based on the discussion of an insightful paper by Lukasz Rachel on the drivers of r* presented at the Brookings Papers on Economic Activity Fall 2025 conference.
Is There a Global R*? Cross-Country Convergence in R*
The chart below plots estimates of r* using macroeconomic data for the eighteen developed countries included in the Jordà-Schularick-Taylor Macrohistory database. It shows that before the 1980s there is a lot of dispersion in r* across countries. But after the late 1980s this dispersion disappears all of a sudden, arguably as a result of financial market integration. Therefore, after the late 1980s, we can actually talk of a global r*, since the trends in real rates are one and the same across advanced countries. The important implication of this finding, which was first documented in “Global Trends in Interest Rates,” is that both the decline in r* from the 1990s to before COVID and the post-COVID rise that is evident from the chart are global phenomena.
Global Convergence in R*
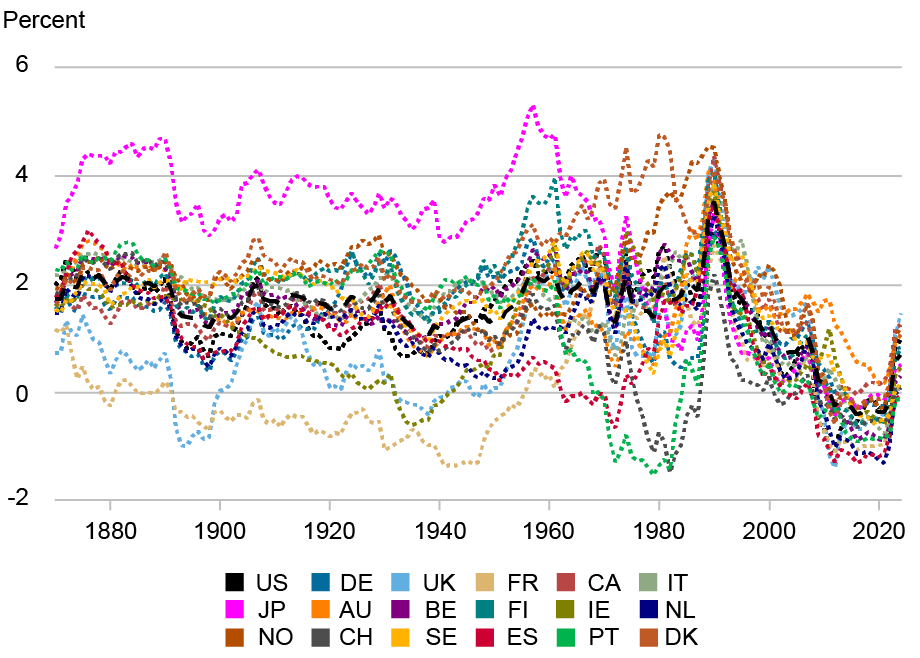
Notes: The chart plots the posterior median estimates of r* for the eighteen countries in the sample, namely Australia, Belgium, Canada, Denmark, Finland, France, Germany, Ireland, Italy, Japan, the Netherlands, Norway, Portugal, Spain, Sweden, Switzerland, the U.K., and the U.S. The estimates were prepared for the Fall 2025 Brookings Papers on Economic Activity (BPEA), © The Brookings Institution
The Decline, and Recent Rise, in the Global (and U.S.) R*
The dashed black line in the chart below shows the posterior median of global r* with the shaded areas showing the 68 and 95 percent posterior coverage intervals. The dotted black line shows the posterior median of U.S. r*. According to the model, global r* fell from about 3 percent in the early 1990s to below 0 percent after the financial crisis. It continued declining in the 2010s and then rose by about 1 percentage point after COVID. By and large, the U.S. r* has tracked global r* since the late 1980s, except that it declined comparatively more in the aftermath of the financial crisis. By 2024, the end of the sample, the median posterior estimates of both global and U.S. r* are around 0.5 percent (more precisely, 0.31 and 0.46). This figure is broadly consistent with “the GDP-weighted average of estimates of r-star for … Canada, the Euro Area, the United Kingdom, and the United States,” according to a recent presentation by New York Fed President and CEO John C. Williams, although the U.S. r* point estimate is a bit below current estimates of U.S. r* from the well-known Laubach-Williams and Holston-Laubach-Williams models, which are about 1 percent. However, the large posterior coverage intervals shown in the chart are there to remind us that extracting trend from cycle is a difficult task, and that one should take point estimates with more than a grain of salt. The 68 percent posterior coverage intervals for both global and U.S. r* range from about -0.5 to above 1 percent, while the 95 percent intervals range from about -1.5 to above 2 percent.
The Global and the U.S. R*
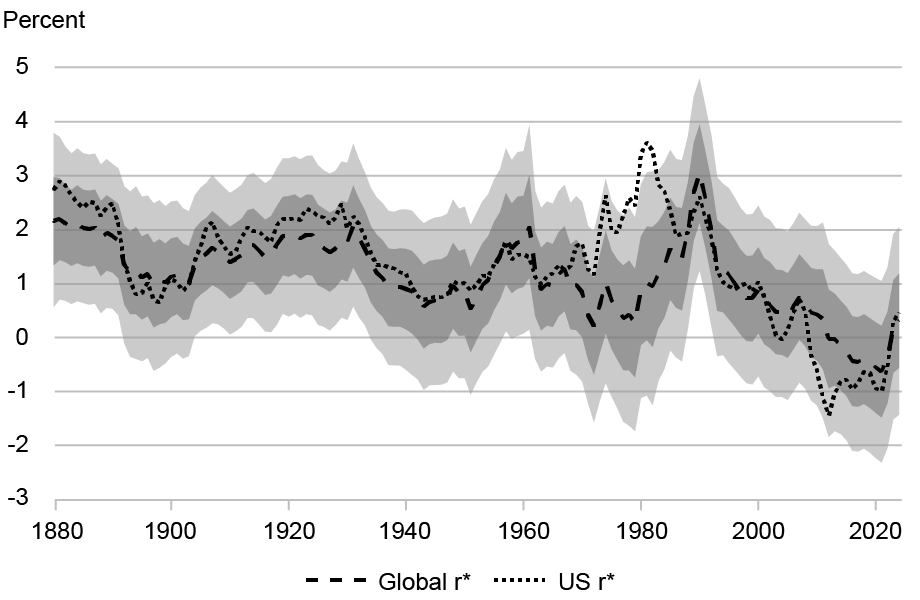
Notes: The dashed black line shows the posterior median of global r* and the shaded areas show the 68 and 95 percent posterior coverage intervals. The dotted black line shows the posterior median of U.S. r*. The estimates were prepared for the Fall 2025 Brookings Papers on Economic Activity (BPEA), © The Brookings Institution
Even if the level of r* is very uncertain, the model is able to detect changes in r* over time with greater statistical confidence. The first row of the table below reports the decline in global and U.S. r* from 1990 to 2019, by our calculations. The median estimate of the decline is about 3.5 percentage points for both the world and the U.S. Although the width of the 95 percent posterior coverage intervals (in parentheses) indicate that the exact magnitude of the decline is uncertain, there is no question statistically that such a decline in r* has taken place from the 1990s to before COVID: the posterior probability that the change is less than zero is greater than 97.5 percent, as indicated by the three stars next to each number.
Pre- and Post-COVID Changes in R*
| Global R* | U.S. R* | |||
| 1990-2019 | 2019-2024 | 1990-2019 | 2019-2024 | |
| Baseline model | ||||
| r* | -3.52*** | 0.79*** | -3.27*** | 1.11*** |
| (-4.94, -2.09) | (0.07, 1.49) | (-5.13, -1.36) | (0.18, 2.06) | |
| Convenience yield model | ||||
| r* | -3.83*** | 1.01*** | -3.11*** | 1.14*** |
| (-5.41, -2.27) | (0.30, 1.70) | (-4.45, -1.75) | (0.42, 1.86) | |
| cy | -1.58*** | 0.35 | -0.85** | 0.49* |
| (-2.64, -0.50) | (-0.17, 0.86) | (-1.57, -0.11) | (-0.05, 1.03) | |
| Other | -2.36*** | 0.65** | -2.26*** | 0.65** |
| (-3.55, -0.98) | (0.08, 1.22) | (-3.55, -0.98) | (0.08, 1.22) | |
Notes: For each trend, the table reports the posterior median, with the 95 percent posterior coverage interval in parentheses. Statistical significance is indicated with *, **, ***, if the posterior probability that the change in the trend is below (for the 1990-2019 period) or above (for the 2019-24 period) zero is greater than 90, 95, or 97.5 percent, respectively. The estimates were prepared for the Fall 2025 Brookings Papers on Economic Activity (BPEA), © The Brookings Institution
Both the table and the charts above also point to a statistically significant rise in both global and U.S. r* in the post-COVID period: of about 0.8 percentage point for the global r* and a little more than 1 percentage point for the U.S. r*. It is important to remark that the magnitude of the increase is smaller than that of the pre-COVID decline, hence r* remains well below what it was in the 1990s. To the extent that one believes the model’s message of a post-COVID increase in r*, it begs the question of what is driving it. Since the increase is not just a U.S. phenomenon but global—the first chart in the post shows that r* rose in pretty much all developed countries—its drivers better be global as well. Purely country-specific explanations for the increase in r* may not be the whole story.
In previous research, some of us have argued that an increase in the global convenience yield—that is, the convenience for safety and liquidity that applies to all advanced economies’ government bonds—is an important driver of the pre-COVID decline in r*. In other words, investors’ appetite for safety (and liquidity) drove government bond yields across advanced economies down between 1990 and 2019. To what extent did a sudden decline in the convenience yield between 2019 and 2024 drive r* up?
The bottom panel of the table above decomposes changes in r* into a component attributable to the convenience yield (“cy”) and a component attributable to other drivers (“Other”). The table shows that indeed the increase in the convenience yield explains about one-third of the decline in r* both for the U.S. and the world between 1990 and 2019. The decline in the convenience yield for government bonds also explains one-third to one-half of the post-COVID rise in r*, although it is not precisely estimated. This decline, which in the U.S. is reflected in a compression of corporate bond spreads, reflects the fact that for a variety of reasons, possibly including the surge in government debt across advanced economies, the appeal of government bonds in the U.S. and around the world in terms of safety and liquidity has declined. At the same time, the table shows that this decline is clearly not the entire story: the change in the remainder is larger and statistically more significant than the change in “cy.”
If not the convenience yield, what explains the post-COVID rise in r*? Two plausible candidates are: a forthcoming artificial-intelligence-driven uptick in productivity growth and future surges in debt-to-GDP, possibly driven by a perceived unwillingness on the part of governments in advanced economies to raise taxes to deal with the demographic transition, and/or by higher expected military spending. Rachel’s Brookings paper considers these scenarios and shows that both factors might well be driving the rise in r*, although the abruptness of the rise is harder to rationalize in the model.
In sum, we find that r* has risen by about 1 percentage point in the U.S. and in advanced economies after COVID, and that about one-third of the change may be due to a decline in the convenience yield for government bonds. The r* estimates discussed in this post, and the replication code, are available on this GitHub page. We hope to update these estimates as new data becomes available.

Marco Del Negro is an economic research advisor in the Federal Reserve Bank of New York’s Research and Statistics Group.

Elena Elbarmi is a research analyst in the Federal Reserve Bank of New York’s Research and Statistics Group.

Michael Pham is a research analyst in the Federal Reserve Bank of New York’s Research and Statistics Group.
How to cite this post:
Marco Del Negro, Elena Elbarmi, and Michael Pham, “The Post‑Pandemic Global R*,” Federal Reserve Bank of New York Liberty Street Economics, February 25, 2026, https://doi.org/10.59576/lse.20260225
BibTeX: View |


Disclaimer
The views expressed in this post are those of the author(s) and do not necessarily reflect the position of the Federal Reserve Bank of New York or the Federal Reserve System. Any errors or omissions are the responsibility of the author(s).
 RSS Feed
 Follow Liberty Street Economics