


Foreign holdings of U.S. financial assets are immense, with official estimates putting their current market value at $69 trillion. U.S. holdings of foreign assets are also impressive but much smaller, at $41 trillion. The shortfall in U.S. foreign assets relative to foreign liabilities has been mounting for decades. Yet U.S. investment income receipts—in profits, dividends, and interest—comfortably exceeded income payments until recently. We show that the fading of the net investment income surplus stems from the upward shift in interest rates in the aftermath of the pandemic along with the continued net sales of U.S. assets to foreign investors.
The U.S. International Balance Sheet
The U.S. international investment position can be summarized via a balance sheet, with foreign assets held by U.S. investors on the asset side, and U.S. assets held by foreign investors on the liability side. The table below, drawn from data compiled by the U.S. Bureau of Economic Analysis, details these claims by asset type. Figures are estimated market values at the end of last year.
U.S. Foreign Assets and Liabilities in 2025
Trillions of U.S. dollars, year-end
| Assets | Liabilities | Net Assets | |
| Total | 41.0 | 68.5 | -27.5 |
| Foreign direct investment | 13.9 | 20.3 | -6.4 |
| Portfolio equity shares | 15.1 | 22.3 | -7.2 |
| Interest-bearing assets | 10.8 | 25.9 | -15.1 |
| Fixed-income securities * | 4.1 | 15.9 | -11.8 |
| Other lending ** | 6.7 | 10.0 | -3.2 |
| Gold held as reserves | 1.1 | NA | 1.1 |
Notes: All figures are estimated market values. Total assets and liabilities exclude the gross notional value of derivative positions; these have a net value of roughly zero.
* Includes securities held as foreign exchange reserves.
** Largely bank loans, bank deposits, and trade credit.
Total U.S. holdings of foreign assets amounted to $41 trillion. Foreign direct investment (U.S. multinationals’ foreign affiliates and large minority stakes in foreign companies) accounted for roughly one-third of these holdings. Portfolio equity holdings accounted for another third. Most of the rest was held in interest-bearing assets, including foreign fixed-income securities, foreign deposits, and cross-border bank loans.
Foreign assets in the U.S. amounted to almost $69 trillion. Of this sum, $20 trillion went to foreign direct investment (FDI) claims, more than $22 trillion was invested in the U.S. stock market, and $26 trillion was held in interest-bearing claims, with Treasuries and other U.S. fixed income securities representing the largest part of this total.
The net U.S. international investment position is simply the difference between U.S. foreign assets and foreign holdings here: -$28 trillion at the end of 2025, or 90 percent of U.S. GDP. Note that U.S. assets fell short of U.S. liabilities in every major category.
The Balance Sheet, Financial Flows, and Valuation Changes
The evolution of the U.S. net investment position is closely connected to the current account balance, the broadest measure of the trade balance. In international commerce, you only get what you pay for. When U.S. exports fall short of imports, the balance must be covered by selling off domestic assets. If the United States runs a current account deficit and purchases foreign assets, still larger asset sales are required to balance the books.
U.S. assets and liabilities are also affected by asset price changes. For example, higher foreign stock prices boost estimated values for U.S. portfolio equity and FDI holdings. Movements in the dollar also play a role, by changing the value of U.S. foreign currency assets when translated into dollar terms. There is no meaningful impact on U.S. liabilities, given that they are denominated almost exclusively in dollar terms.
The solid red line in the chart below shows the evolution of the U.S. international investment position over the past two decades. (We’ll discuss the dotted blue line in the next section.) Note that the net position turned more negative by $16 trillion since the end of 2019, from -$12 trillion to -$28 trillion.
Huge Net Liabilities, but Net Income Still Slightly Positive
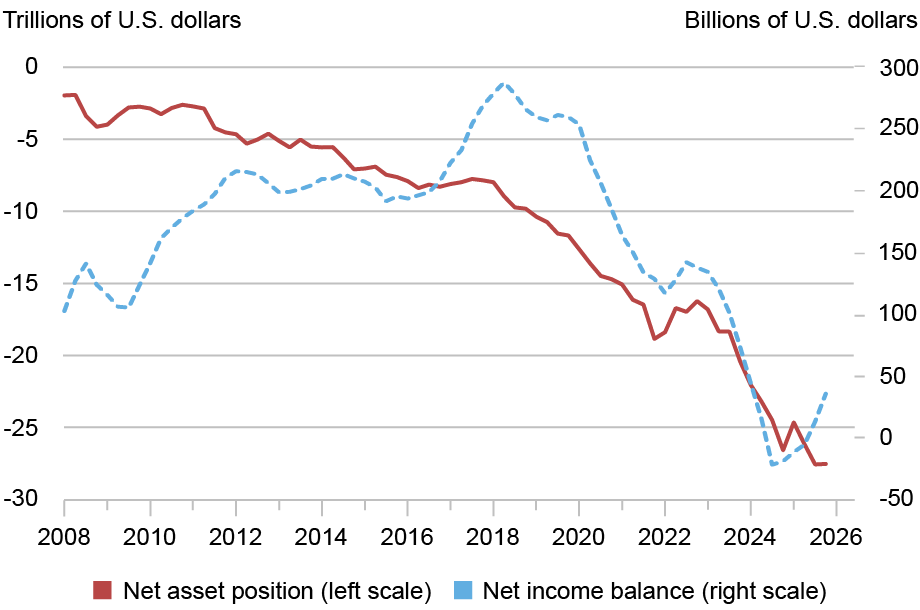
Notes: Net asset position is at market value. Net income is measured as a four-quarter rolling sum.
Financial flows accounted for -$5.5 trillion of this deterioration, with U.S. purchases of foreign assets at almost $6 trillion but foreign purchases of U.S. assets totaling more than $11 trillion. Aside from the small statistical discrepancy, the -$5.5 billion in net asset purchases matches the cumulated U.S. current account deficit over the period, in line with the “You only get what you pay for” principle described above.
Valuation changes have subtracted $10 trillion from the U.S. net position since 2019, adding $6 trillion to U.S. assets but a massive $16 trillion to U.S. liabilities. Most of the gain on both sides of the ledger reflects the impact of higher stock prices on estimated portfolio equity and FDI holdings. (The larger gain on the liability side owes to a booming U.S. stock market.) There was little net impact from exchange rate changes.
The Income Surplus Puzzle
While U.S. net liabilities have continued to mount, the U.S. income balance has seemed to defy gravity. To be sure, the income balance has fallen in recent years, from a surplus $260 billion in 2019 to near zero in 2024 and 2025. (See the dotted blue line in the chart above.) But it remains far out of line with the massive U.S. liability position. What explains this disconnect?
A breakdown of net income flows by asset type provides important clues. The chart below shows flows beginning in 2008, broken down into FDI income (profits), portfolio equity income (dividends), and interest income.
Growing Interest Deficit Weighs on Net Income Balance
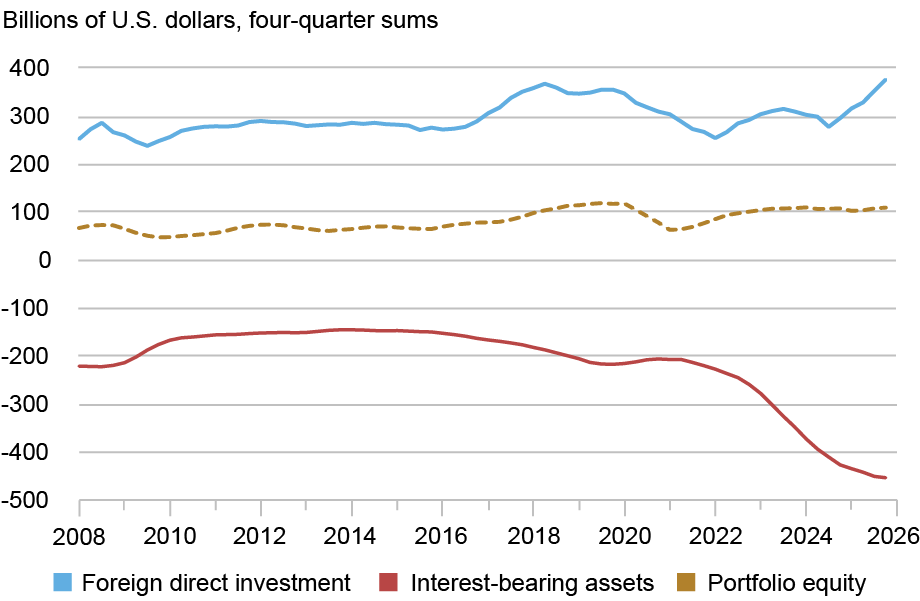
Note: Figures show four-quarter sums for income receipts less income payments.
The U.S. FDI position has generated a consistent net income surplus, dipping as low as $250 billion during the height of the pandemic, but rebounding to $360 billion more recently. The U.S. portfolio equity position has also generated a consistent surplus, at roughly $70 billion to $120 billion since 2019. The combination of income surpluses and position deficits in these asset categories comes with a clear implication: U.S. assets earn higher rates of return than similar liabilities.
The U.S. position in interest-bearing assets, in contrast, has generated large income deficits since prior to the 2008 financial crisis. Net interest payments have swelled since the pandemic, with the interest balance reaching -$450 billion last year. This increase in interest payments accounts for the shrinking of the U.S. income surplus.
The U.S. Rate of Return Advantage
Rates of return on foreign assets can be measured by the ratio of income receipts to market value. Income on FDI assets includes dividends remitted to the parent company plus reinvested earnings. Income on portfolio equity consists of dividends. Income on interest-bearings assets includes coupon and other interest receipts.
The chart below shows rates of return for U.S. FDI assets and liabilities, with far higher returns for U.S. investment abroad. The returns gap explains how a positive FDI income balance can exist alongside a negative net asset position. (To take the latest figures, a profit rate of 5.6 percent on $14 trillion in assets easily exceeds a rate of 1.8 percent on $20 trillion in liabilities.) The FDI income surplus, in turn, has been the main factor keeping the overall U.S. income balance in positive territory.
Persistent Superior Returns for U.S. FDI Assets
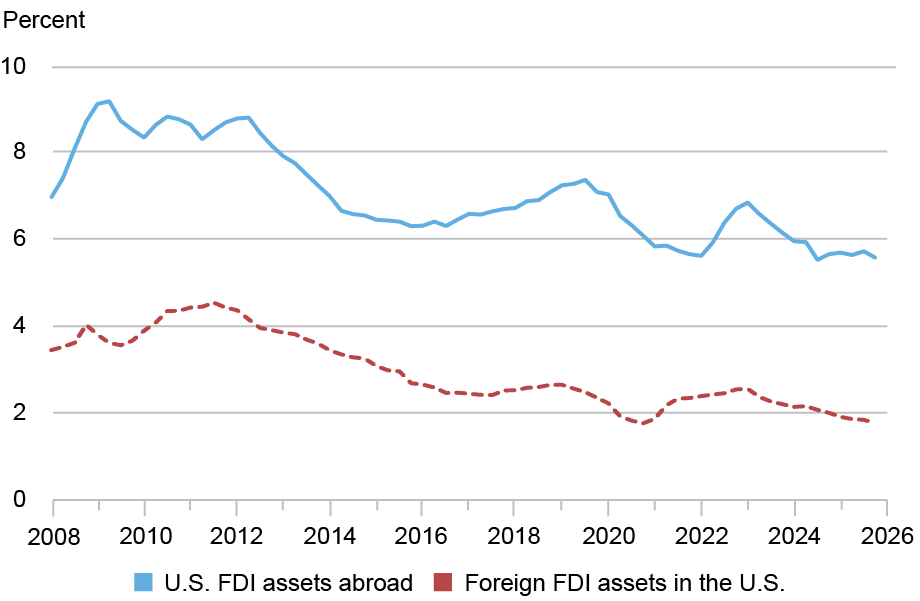
Note: Returns are measured as income-receipts or payments of the past four quarters divided by estimated market values.
The U.S. advantage in FDI profitability has attracted considerable skepticism, with some observers arguing that it represents a statistical illusion, perhaps from corporate tax arbitrage strategies. This debate has been ongoing for more than three decades—see our earlier work—and we do not propose to settle it here.
The U.S. also enjoys a longstanding rate of return advantage on portfolio equity investments. Although this gap is less stark than for FDI, it remains more than enough to outweigh the large shortfall in U.S. assets relative to liabilities. The portfolio income surplus has been a supporting factor in keeping the aggregate income balance in positive territory.
Finally, the chart below shows rates of return for interest-bearing assets and liabilities. Historically, these rates have tended to move together, partly because both assets and liabilities are denominated largely in dollars. A second reason is that central banks in the U.S. and abroad often face common global shocks.
Similar Returns on Interest-Bearing Assets and Liabilities
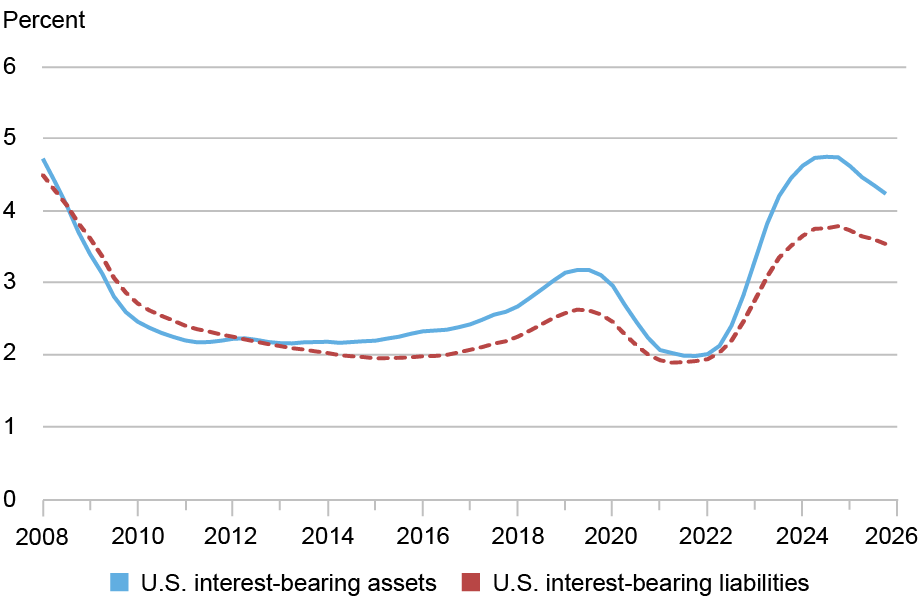
Note: Returns are measured as income-receipts or payments over the past four quarters divided by estimated market values.
Note the sharp rise in U.S. and foreign rates in 2022 and 2023, during the post-pandemic recovery. Given the large U.S. net liability position in interest-bearing assets, higher rates translate into a significant drag on net income. According to our calculations, some $170 billion of the $240 billion increase in net payouts since 2021 owes to higher interest rates. The remainder owes to ongoing growth in U.S. net liabilities. Notably, only the partial retracement in market rates since 2024 has prevented the interest deficit from growing even more sharply.
Conclusion
Payments on U.S. assets owned by foreign investors represent a servicing burden for the U.S. economy. Profits, dividends, and interest payments that would otherwise accrue to domestic investors instead flow abroad. Given the need to sell U.S. assets to finance ongoing trade deficits, this servicing burden seems likely to mount.
The related buildup in the U.S. net liability position in interest-bearing assets will also make the income balance more sensitive to swings in interest rates. This increased sensitivity is already in evidence. At present, with the asset-liability gap at -$15 trillion, a 1 percentage point increase in U.S. and foreign interest rates would subtract $150 billion from the U.S. net income balance. (A 1 percentage point fall in rates would result in a similar improvement.) Only five years ago, a 1 percentage point rise in rates would have subtracted $100 billion.

Matthew Higgins is an economic policy advisor in the Federal Reserve Bank of New York’s Research and Statistics Group.

Thomas Klitgaard is an economic policy advisor in the Federal Reserve Bank of New York’s Research and Statistics Group.
How to cite this post:
Matthew Higgins and Thomas Klitgaard, “Honey, Who Shrunk the U.S. Income Surplus?,” Federal Reserve Bank of New York Liberty Street Economics, May 18, 2026, https://doi.org/10.59576/lse.20260518
BibTeX: View |


Disclaimer
The views expressed in this post are those of the author(s) and do not necessarily reflect the position of the Federal Reserve Bank of New York or the Federal Reserve System. Any errors or omissions are the responsibility of the author(s).
 RSS Feed
 Follow Liberty Street Economics