In a companion post, we examined the recent trends in arbitraged-based measures of liquidity in the cash bond and credit default swap (CDS) markets. In this post, we turn to the mechanics of the CDS-bond arbitrage trade and explore how the costs and profitability of such trades might be affected by the finalization of the supplementary leverage ratio (SLR) rule in September 2014.
The Mechanics of the Spread Trade
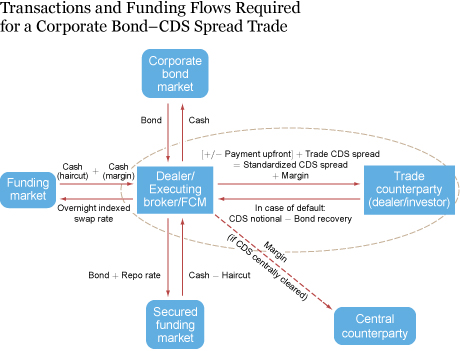
The figure below illustrates the transactions required to complete the CDS-bond trade from the perspective of a dealer trading for its own book using repo financing to purchase the bond.
The Cash Leg:
- The dealer purchases the bond for cash from the corporate bond market.
- The dealer “repo finances” the purchase in the secured funding market, using the bond as collateral. The dealer pays the repo interest rate and receives the market value of the bond used as collateral, less the “haircut” required by the repo lender.
- The dealer finances the haircut by borrowing in the short-term (unsecured) funding market, paying the overnight indexed swap rate (OIS).
The Derivatives Leg:
- The dealer purchases a credit default swap (CDS) to protect against default by the bond issuer. The dealer pays the quarterly CDS premium (or “spread”) to the seller. At initiation of the contract, the dealer also pays the seller the upfront—the difference between the actuarially fair CDS spread and the standardized CDS spread.
- The CDS transaction requires the dealer to post initial margin with either the central counterparty (if the CDS is cleared) or market participant (if uncleared), and to post additional (variation) margin if the market value of the CDS declines. The dealer funds the initial margin and any variation by borrowing in the short-term (unsecured) funding market.

Profitability and the Supplementary Leverage Ratio
The supplementary leverage ratio in the United States requires banks to hold Tier 1 capital of at least 3 percent of their total leverage exposure; global systemically important banks (G-SIBs) are subject to the enhanced SLR (e-SLR), which requires an SLR of greater than 5 percent. In order to better understand how the SLR may affect the willingness of dealers to enter into spread trades, we use a stylized example to illustrate how post-crisis regulatory changes may have impacted the profitability of spread trades.
The SLR increases the costs to a dealer of a negative CDS-cash basis trade because it modifies how off-balance-sheet items, including credit derivatives and repo transactions, are accounted for in the denominator of the ratio. The SLR requires supervised institutions to recognize a fraction of the effective notional amount of CDS sold in the denominator of the ratio. Additionally, a long and a short CDS exposure can be netted only if both positions reference the same legal entity.
The SLR also affects margin requirements; if a single-name CDS is not centrally cleared, a dealer purchasing the CDS needs to both post initial margin with and collect initial margin from the seller of protection. If the single-name CDS is centrally cleared, both the buyer and the seller must post margin with the CCP, with the seller usually posting twice as much margin.
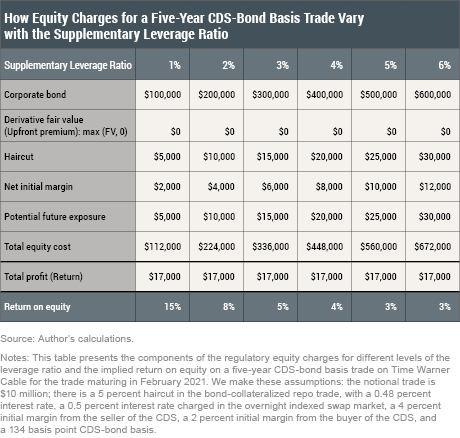
For the CDS-bond trade, the SLR requires dealers to hold additional capital against the cash position, the initial margin, the repo haircut, and the potential future exposure (PFE) of the derivative. The table below illustrates the capital charges for each of these components under different target SLRs and the following assumptions: a 5 percent haircut on the repo trade; a 0.48 percent interest rate; a 0.5 percent interest rate in the OIS market; a 4 percent initial margin from the CDS seller; and a 2 percent initial margin from the CDS buyer.

The largest capital charge is associated with the bond position since that charge is based on the entire face value of the bond financed in repo: for a 1 percent leverage ratio, the capital charge associated with the $10 million corporate bond position financed in repo is $100,000. The $10 million corporate bond position in this example is subject to a 5 percent haircut; the associated capital charge at 1 percent leverage is $5,000. On the CDS side, the dealer receives 4 percent initial margin from the seller of insurance and posts 2 percent initial margin with the seller of insurance, resulting in a $2,000 capital charge. In addition, since the CDS position is not centrally cleared and the CDS trade has a five-year maturity, the dealer has to post capital against the 5 percent potential future exposure of the CDS contract. The overall capital cost for the CDS-bond trade at a 1 percent leverage ratio is $112,000, which increases to $672,000 at a 6 percent leverage ratio. Based on a 134 basis point CDS-bond basis for this bond quoted in February 2016, initial margin, and haircut funding costs, plus the interest rate charged on repo funding, the total profit from the $10 million trade is $17,000.
The bottom line of the table reports the implied return on equity (ROE) on this trade based on a negative CDS-bond basis of 134 basis points. The ROE falls sharply with the target SLR, declining from 15 to 8 percent when the SLR target increases from 1 to 2 percent. The SLR for the largest U.S. banks was around 6 percent in 2015; at that level, the ROE for the spread trade is at most 3 percent, a fifth of the 15 percent ROE reportedly targeted by dealers on average.
Conclusion
While we cannot precisely measure the costs associated with the SLR capital requirements, it does appear that executing credit basis arbitrage trades is now costlier—and less profitable—largely due to the extra capital these trades require. The amount of capital required depends largely on the cash instrument position of the trade, which is fully recognized, rather than the derivatives portion. As a result, while the recent CDS-cash basis levels may have created attractive trades in the past, our analysis suggests that more negative spreads are now required to cover dealers’ heightened balance sheet costs and to generate adequate returns on equity. These considerations indicate that there may be a “new normal” level at which dealers are incentivized to enter into spread trades. If dealers are less willing to participate in spread-narrowing trades, market liquidity in both corporate bond and CDS markets may suffer as, historically, dealers have been the providers of liquidity in both markets.
Disclaimer
The views expressed in this post are those of the authors and do not necessarily reflect the position of the Federal Reserve Bank of New York or the Federal Reserve System. Any errors or omissions are the responsibility of the authors.

Nina Boyarchenko is an economist in the Federal Reserve Bank of New York’s Research and Statistics Group.

Pooja Gupta is a senior associate for policy and markets analysis in the Bank’s Markets Group.

Nick Steele is an associate for policy and markets analysis in the Bank’s Markets Group.

Jacqueline Yen is a quantitative and policy analysis manager in the Bank’s Markets Group.
How to cite this blog post:
Nina Boyarchenko, Pooja Gupta, Nick Steele, and Jacqueline Yen, “Credit Market Arbitrage and Regulatory Leverage,” Federal Reserve Bank of New York Liberty Street Economics (blog), January 11, 2017, http://libertystreeteconomics.newyorkfed.org/2017/01/credit-market-arbitrage-and-regulatory-leverage.html.


 RSS Feed
 Follow Liberty Street Economics
Consider taking the analysis one step farther. If the SLR means that the arbitrage trade no longer provides sufficient return on capital for the dealer, why doesn’t a non-dealer pool of capital (a hedge fund) step in to police the arbitrage boundaries? The non-dealer pool of capital does not have direct access to that OIS minus 2 repo financing, but requires intermediation (on balance sheet) by the dealer as a credit upgrade to the financing provider. Given SLR requirements, the dealer needs to be paid not only the value of the credit upgrade, but also a return on capital for the balance sheet required for that low-risk money broking. If that requires a return on balance sheet of, say, 30 basis point, then the 17bps return on notional in the chart becomes a loss instead.