The Federal Reserve lends specific Treasury and agency debt securities held in its System Open Market Account (SOMA)—and accepts general Treasury securities as collateral—through its daily securities lending program. The program supports Treasury and agency debt market function by providing a secondary and temporary source of securities to the broader market through the Fed’s trading counterparties, the primary dealers. Importantly, the size and composition of the SOMA portfolio reflect past monetary policy decisions, limiting the program’s ability to help alleviate all collateral shortages. In this post, we provide a brief history of the Fed’s securities lending program and describe recent trends in activity and what is driving them.
Why Market Participants Borrow Securities
The main reason market participants borrow securities is to facilitate short positioning. Market participants take short positions in securities—that is, sell securities they do not own—to hedge long positions in other securities, to make markets to their customers, and to speculate on the course of interest rates. Borrowing securities enables market participants to meet their delivery obligations and thereby avoid the risks and costs associated with settlement fails.
Launch of the Program
The Federal Open Market Committee first approved a securities lending program in 1969 in response to an increase in settlement fails (see “Dealer behavior in the specials market for US Treasury securities,” for details). The Fed was concerned that heightened fails could affect the willingness of dealers to trade with the Fed for same-day settlement and thereby impair the transmission of monetary policy to other interest rates. The program was designed to mitigate fails by allowing dealers to temporarily borrow securities to meet their delivery obligations.
Initially the program enabled primary dealers to borrow securities for up to three business days at a fixed fee. The fee was set above the private-market borrowing rate to reinforce the view that the Fed was a secondary source of securities. A dealer also had to certify that it needed the securities to replace securities that a seller had failed to deliver rather than to cover a short sale, and that it was unable to borrow the securities elsewhere. Each dealer was limited to borrowing $10 million of any note or bond and $50 million of any bill, and could not borrow more than
$75 million in aggregate. The loans were collateralized with Treasury securities of comparable value, and not cash, so that the program would not affect the level of bank reserves.
The 1999 Revision
After thirty years, the Fed revised the securities lending program dramatically in 1999 by introducing an auction to allocate securities, removing the certification requirements, and increasing dealer per-issue and aggregate borrowing limits. As a result, dealers were able to borrow more of the Fed’s holdings and for any legitimate purpose, including shorting. Nonetheless, underlining the program’s continued role as a secondary source of market liquidity, the Fed limited loans to overnight, set the auction at noon Eastern time—after the most liquid period of trading in Treasury financing markets—and maintained issue and dealer borrowing limits, albeit less constrictive than under the initial program.
The Program Today
The securities lending program today largely follows the auction format introduced in 1999, although lending limits and minimum lending fees have changed many times since. Current terms and conditions allow dealers to borrow up to 25 percent of the amount available of each issue at a minimum lending fee of 5 basis points (per annum), and with an aggregate borrowing limit across all securities borrowed of $5 billion per dealer. Results of each day’s operation are posted on the New York Fed’s website shortly after the operation closes at 12:15 p.m. Eastern time, and include amount submitted, amount accepted, and the weighted average fee per security. Daily historic data for each security lent back to
April 1999 are also available via the New York Fed’s website.
Evolution of Lending
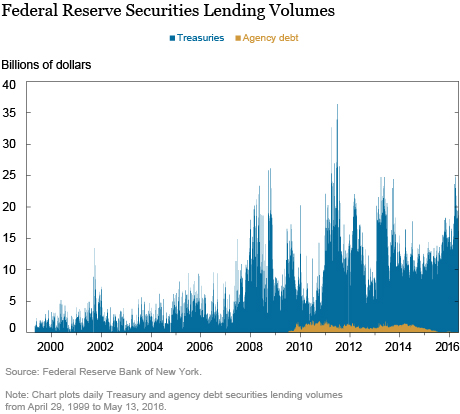
As shown in the chart below, the Fed’s securities lending volumes have varied considerably since the 1999 revision. They increased sharply during the financial crisis and have remained high since. Average daily lending volume in Treasuries averaged $1.9 billion per day over the pre-crisis period from April 1999 to July 2007, but $10.9 billion per day between August 2007 and May 2016. Much of the lending was historically of on-the-run or benchmark securities, but their share fell from 41 percent of Treasury lending, on average, during the pre-crisis period to only
15 percent thereafter. Agency debt securities, bought in response to the financial crisis, have accounted for 8 percent of lending, on average, since July 2009. The program does not lend the Fed’s holdings of agency mortgage-backed securities.

What Explains this Evolution?
Many factors explain the evolution in the quantity and composition of the Fed’s securities lending. Over short periods, operational disruptions explain some of the variation. For example, the September 11th terrorist attacks increased demand to borrow securities from the Fed to meet settlement needs, as described in this article on settlement fails after September 11.
Developments in individual security lending markets also affect security-borrowing demand. Newly issued or benchmark Treasury securities often are in high demand and trade at a premium in securities lending markets, as described in this article. Not surprisingly, these securities tend to see higher demand in the Fed’s securities lending operations. In March 2016, for example, the on-the-run ten- and thirty-year securities became costly to borrow, and demand to borrow these securities from the Fed increased commensurately, as described in this post on the spike in Treasury fails at the time.
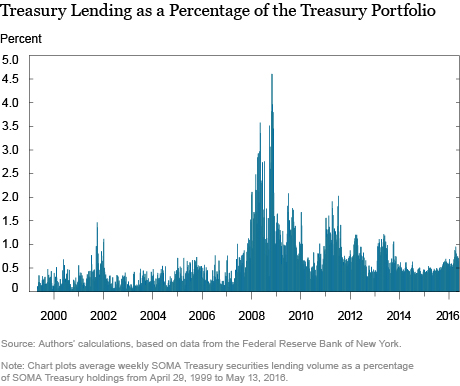
Also affecting the amount of securities lending is the size of the SOMA. As a result of the Fed’s Large-Scale Asset Purchases (LSAPs), SOMA holdings of Treasury securities rose from $791 billion in July 2007 to $2.5 trillion in late 2014, thus increasing the quantity of securities available for lending. The chart below shows that SOMA Treasury lending as a percentage of the Treasury portfolio increased less than SOMA lending in dollar terms, but still increased appreciably, especially during the financial crisis.

Further factors explaining the evolution of lending are the securities lending program’s terms and conditions. After the financial crisis intensified in late 2008, Treasury settlement fails rose precipitously, leading the Fed to increase dealer lending limits and to lower the minimum lending fee to 1 basis point. The current minimum lending fee of 5 basis points is lower than the 75 to 150 basis point minimum imposed over the eight years preceding the crisis. Since August 2007 the minimum lending fee has ranged between 1 and 50 basis points.
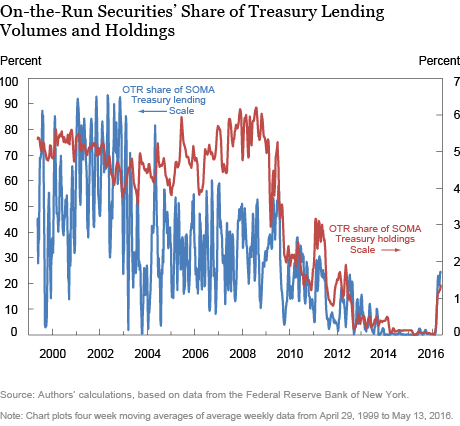
Another important factor affecting lending is the mix of securities in the SOMA. The LSAPs, the Fed’s operations to drain reserves early in the crisis to offset the growth in reserves due to its liquidity programs, and the Maturity Extension Program all had a marked effect on the composition of the Fed’s portfolio. In particular, as shown in the chart below, SOMA holdings of on-the-run securities as a percentage of all Treasury holdings dropped sharply during the financial crisis, and closely track SOMA lending of on-the-run securities as a percentage of all Treasury lending. Since earlier this year, benchmark holdings have started to increase, but they remain far below the level observed pre-crisis.

Looking Ahead
Going forward, increased lending of benchmark securities seems likely as the share of benchmark holdings grows under the current policy of rolling over maturing Treasury securities at auction. Increased lending should reduce borrowing costs in the securities lending market and mitigate settlement fails. Indeed, recent research documents the negative relationship between security supply and borrowing costs. Nonetheless, as the March rise in Treasury settlement fails indicates, heightened specialness and elevated settlement fails can occur despite the availability of the Fed’s SOMA holdings. The Fed’s securities lending program helps alleviate security supply shortages and mitigate settlement fails, but its effects are limited by the size and composition of SOMA holdings relative to market demand to borrow specific securities.
Disclaimer
The views expressed in this post are those of the authors and do not necessarily reflect the position of the Federal Reserve Bank of New York or the Federal Reserve System. Any errors or omissions are the responsibility of the authors.
 Michael J. Fleming is a vice president in the Federal Reserve Bank of New York’s Research and Statistics Group.
 Frank M. Keane is an assistant vice president in the Bank’s Markets Group.
 Jake Schurmeier is a policy and market analysis associate in the Bank’s Markets Group.
 Emma Weiss is a policy and market analysis associate in the Bank’s Markets Group.
How to cite this blog post:
Michael J. Fleming, Frank M. Keane, Jake Schurmeier, and Emma Weiss, “A Closer Look at the Federal Reserve’s Securities Lending Program,” Federal Reserve Bank of New York Liberty Street Economics (blog), August 17, 2016, http://libertystreeteconomics.newyorkfed.org/2016/08/a-closer-look-at-the-federal-reserves-securities-lending-program.html.


 RSS Feed
 Follow Liberty Street Economics
Thank you for your question. Most activity in the MBS market, including shorting, takes place in the TBA market (for a detailed discussion of the TBA market, see this article: https://www.newyorkfed.org/research/epr/2013/1212vick.html). That is, specific MBS are not usually shorted. Moreover, if a dealer borrowed and then on-lent specific MBS, it would likely not be able to find the same MBS to return to the Fed. This reflects the fact that the MBS market consists of a very large number of often very small issues (whereas the Treasury market consists of a modest number of very large issues). Note that the Fed does conduct dollar roll transactions on its unsettled TBA positions to help facilitate settlement of those transactions (see here for additional discussion of the Fed’s dollar roll transactions: https://www.newyorkfed.org/markets/mbs_FAQ.HTML).
Nice article, thank you. With $1 3/4 trillion in agency MBS securities in the SOMA portfolio, why don’t we lend them out?