Breakeven inflation, defined as the difference in the yield of a nominal Treasury security and a Treasury Inflation-Protected Security (TIPS) of the same maturity, is closely watched by market participants and policymakers alike. Breakeven inflation rates provide a signal about the expected path of inflation as perceived by market participants although they are also affected by risk and liquidity premia. In this post, we scrutinize the dynamics of breakeven inflation, highlighting some intriguing behavior which has persisted for a number of years and even through the pandemic. In particular, we document a substantial downward shift in the level of breakeven inflation as well as a marked flattening of the breakeven inflation curve.
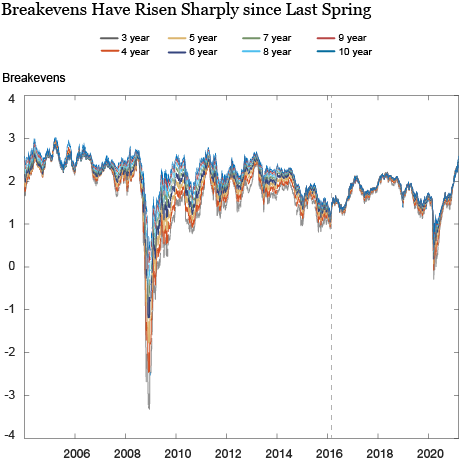
In the chart below, we show the evolution of breakeven inflation rates for maturities from three years to ten years since 2004 (we start in 2004 for data availability and reliability reasons). Breakeven inflation rates tend to broadly move together over the whole sample, but their level can fluctuate substantially. In particular, breakeven inflation rates have risen sharply across maturities starting in late March 2020 with this upward movement continuing to date. On the last day of our sample (3/12/2021), the ten‑year breakeven inflation stood at 2.37 percent, a level last seen in early 2014.

Source: Federal Reserve Board; authors’ calculations.
Note: Vertical line is placed at March 2016. Treasury and TIPS yield data are obtained from fitted Nelson-Siegel-Svensson parametric curves and available for download here and here.
Another notable feature of the chart is the convergence of breakeven inflation rates, that is, flattening of the breakeven curve, starting in March 2016 (the vertical line). The curve has remained compressed since, with small exceptions; for example, in March-May 2020 due to pandemic-related market distress. Compressions of the term structure also occurred in the pre-crisis period, between 2004 and 2006, but proved to be shorter lived.
The overlapping nature of breakeven rates (that is, the five-year breakeven rate and the ten-year breakeven rate share the first five years in common) masks important information. To disentangle market perceptions about different points in the future, we utilize the concept of forward breakeven inflation which represents the breakeven inflation rate over a specific period. For example, suppose one were interested in a signal about market-implied average expected inflation over a five-year period but starting five years in the future. This is referred to as the 5-year/5-year (5Y5Y) forward breakeven rate and is a common measure monitored by central banks (for example, see discussion in FOMC transcript here and here or for the ECB here). Similarly, one might be interested in a signal about market-implied average expected inflation over a one-year period but starting in four years — the 1Y4Y forward breakeven rate.
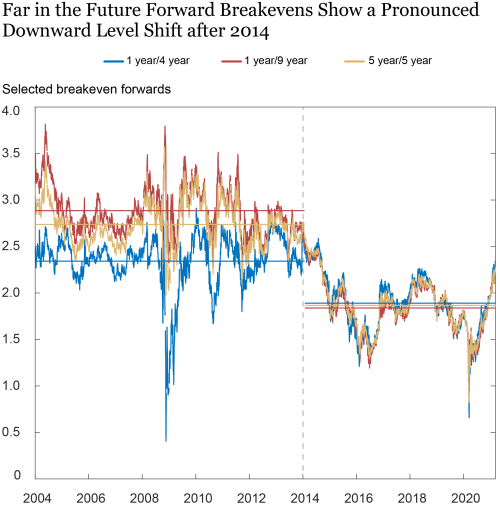
In the next chart, we plot forward breakeven inflation rates for the 1Y4Y, 5Y5Y, and 1Y9Y maturities. By focusing on these forward periods starting at least four years in the future, we can hopefully steer clear of temporary influences on near-term breakeven inflation such as seasonality effects (TIPS are linked to the non-seasonally-adjusted CPI (all items) index) or transient distortions induced by the pandemic. By shifting to forward rates, we observe two intriguing features of breakeven inflation rates:
First, there is a sharp and persistent level shift down after December 2013. Second, there is a striking cross-sectional compression of breakeven forwards; that is, the breakeven forward curve collapsed onto itself and has been essentially flat for over seven years (that is, the lines are almost on top of each other in the second part of the sample).

Source: Federal Reserve Board; authors’ calculations.
Note: Vertical line is placed at January 2014. Horizontal lines depict averages over the two subsamples. Treasury and TIPS yield data are obtained from fitted Nelson-Siegel-Svensson parametric curves and available for download here and here.
The downward shift in forward breakeven inflation rates is illustrated by the horizontal lines in the chart which represent the average values for the periods from January 2, 2004 to December 31, 2013 and January 2, 2014 to March 12, 2021. Comparing the two sub-periods, the average level of 5Y5Y forward breakeven inflation rates fell by about 85 basis points whereas the 1Y9Y forward rate declined by more than 100 basis points. To provide some historical context, discussions of the “secular stagnation” hypothesis became more prominent around this time, including a well-publicized speech by Larry Summers to the IMF. Meanwhile, central bank policy was characterized by the so-called “lower for longer” regime when the short rate is near the effective lower bound (see Yellen (2018) and Reifschneider and Williams (2000)). For example, at the December 2013 FOMC meeting the Committee stated that it “…likely will be appropriate to maintain the current target range of the federal funds rate well past the time that the unemployment rate declines below 6-1/2 percent.” These forward guidance policies were complemented by large-scale asset purchases, in part, because of the consistent undershooting of their corresponding inflation target in the post-2013 period. Another distinguishing feature of this period is the strong co-movement between oil prices and breakevens.
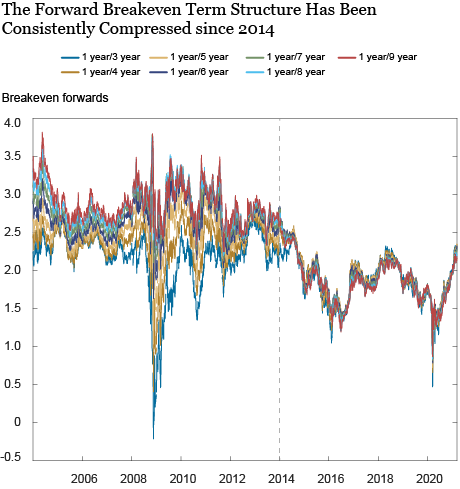
The cross-sectional convergence of breakeven forwards is illustrated in the preceding chart by the breakeven inflation lines coming together after December 2013. This compression of the forward breakeven term structure starts roughly two years earlier than that for the breakeven rates documented in the first chart. Furthermore, for forward breakeven rates this compression is unprecedented in the sample. The next chart shows that this pattern holds for the full term structure of 1-year forward rates from 3 years to 9 years in the future.

Source: Federal Reserve Board; authors’ calculations.
Note: Vertical line is placed at January 2014. Treasury and TIPS yield data are obtained from fitted Nelson-Siegel-Svensson parametric curves and available for download here and here.
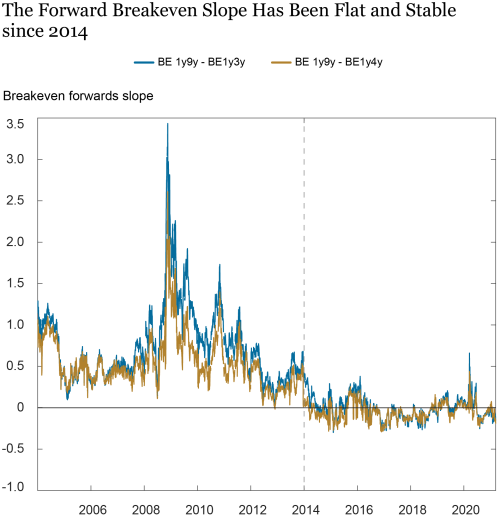
We also illustrate this stark change in behavior in the chart below by looking at the slope of the breakeven forward curve, defined by the 1Y9Y breakeven forward rate minus a shorter horizon forward rate. There is a clear change in behavior in the post-2013 period with only small oscillations around zero as compared to a much more pronounced upward slope (that is, larger, positive values) before.

Source: Federal Reserve Board; authors’ calculations.
Note: Vertical line is placed at January 2014, while the horizontal line is placed at 0. Treasury and TIPS yield data are obtained from fitted Nelson-Siegel-Svensson parametric curves and available for download here and here.
What does this compression imply? Economists generally believe that breakeven inflation rates are comprised of:
(a) The marginal investor’s expected inflation rate;
(b) Additional compensation that is required by the investor for the fact that realized inflation may be different from their expectation;
(c) Other compensation that might be required, such as a liquidity premium, because TIPS are not as liquid as nominal Treasury securities, or a convexity term, driven by the uncertainty surrounding future inflation.
For simplicity, we will refer to (b) and (c) as inflation risk premia.
If inflation risk premia were zero, we could read off expected inflation directly from breakeven inflation rates. That is, if the 1Y4Y forward breakeven rate was 2.3 percent then it would imply that investors expect CPI inflation to average 2.3 percent in the year beginning in March 2025.
However, since inflation risk premia are unlikely to be zero, a robust and reliable way is needed to separate out these constituent components so as to infer expected inflation from breakeven inflation rates. While this generally requires an asset pricing model, the cross-sectional compression of breakeven inflation rates may enable us to draw stronger conclusions without relying on a model. In particular, since the forward breakeven curve has been essentially flat for many years, we can infer that curves of forward expected inflation rates and forward inflation risk premia are either:
(1) Both flat;
(2) Upward or downward sloping, but with each curve a mirror image of the other, so they are essentially offsetting.
Can we tell whether (1) or (2) is the more likely explanation? Not for certain, but we can endeavor to make an educated guess. Note that the level of forward breakeven rates moves around a lot over this period ranging from just below 3 percent in the beginning of 2014 to less than 1 percent in March 2020. We would argue that (2) becomes more tenuous as a description of reality because offsetting curves are a knife-edge case. Over a short time period, this countervailing behavior might occur, but it is unlikely that this would persist over such a long time period.
It is important to emphasize that if (1) is indeed the correct explanation, this does not imply that expected inflation or inflation risk premia are not varying over time. Instead, it would imply that there is a single dominant force for breakeven inflation rates across maturities over this period. This, in turn, has implications for asset pricing models which endeavor to jointly describe the behavior of interest rates in the Treasury and TIPS markets.
To conclude, we document two striking properties of the forward breakeven inflation curve over the last seven years: (1) a persistent level shift down and (2) cross-sectional compression. Going forward, it will be interesting to see if these features of the markets change, perhaps because of investors’ responses to the FOMC’s new flexible average inflation targeting framework, and what that implies for our understanding of this unprecedented behavior.
 Richard K. Crump is a vice president in the Federal Reserve Bank of New York’s Research and Statistics Group.

Nikolay Gospodinov is a financial economist and senior advisor at the Federal Reserve Bank of Atlanta.
 Desi Volker is an economist in the Federal Reserve Bank of New York’s Research and Statistics Group.
How to cite this post:
Richard K. Crump, Nikolay Gospodinov, and Desi Volker, “The Persistent Compression of the Breakeven Inflation Curve,” Federal Reserve Bank of New York Liberty Street Economics, March 22, 2021, https://libertystreeteconomics.newyorkfed.org/2021/03/the-persistent-compression-of-the-breakeven-inflation-curve.html.
Related Reading
Decomposing Real and Nominal Yield Curves
The Term Structure of Expectations and Bond Yields
Are Long-Term Inflation Expectations Declining? Not So Fast, Says Atlanta Fed
Disclaimer
The views expressed in this post are those of the author(s) and do not necessarily reflect the position of the Federal Reserve Bank of New York or the Federal Reserve System. Any errors or omissions are the responsibility of the authors.


 RSS Feed
 Follow Liberty Street Economics