The tri-party repo market is a large and important market where securities dealers find a substantial amount of short-term funding. Despite its importance, this market was very opaque before the crisis. Since March 2010, in accordance with recommendation 13 of the Task Force on Tri-Party Repo Infrastructure Reform report, the Federal Reserve Bank of New York has made monthly data on the tri-party repo market available to the public. Today, with our new interactive tool, there is a whole new way to view the market and its evolution. You can make your own charts, looking at volumes for specific asset classes, at haircuts, or at concentration, over your preferred time horizon.
Starting in March 2010, the New York Fed began posting monthly snapshots of data from the tri-party repo market in PDF and Excel format. While this greatly improved transparency, it offered a cumbersome means of seeing how the market was evolving over time.
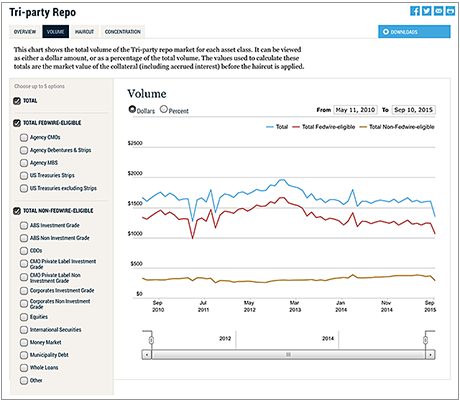
Now, with the tri-party repo interactive tool, seeing how the market is evolving has become remarkably easy. For example, you may be interested in finding out how the market’s size has changed over time or how the composition of financing has evolved. You can do either one in three clicks under the Volume tab. Try it—it’s easy and fun!
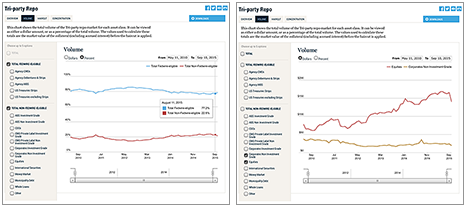
What you see is that the market as a whole has fluctuated between $1.5 trillion and $2 trillion and that riskier assets represent less than $500 billion. Another view reveals that the share of riskier assets has been around 20 percent but has increased in recent months. It was as low as 14.5 percent in June 2012 and as high as 23.5 percent in May 2015.
You are probably wondering, do dealers finance more non-investment-
grade corporate bonds or equities in the market today than they did last year? With a couple of clicks, you find that the amount of non-investment-
grade corporate bonds has been stable. In contrast, the amount of equities financed in the market has increased a lot since early 2012.
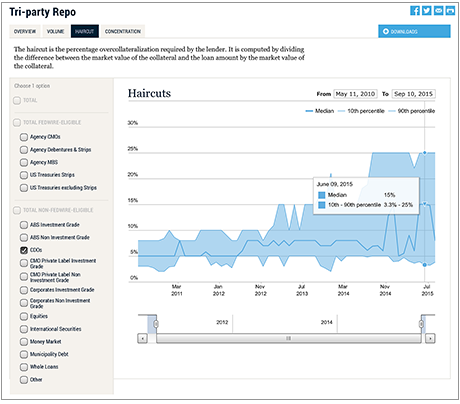
Repo haircuts have been much discussed in the press and in policy circles, so what is happening there? Under the Haircut tab, you can look at the median haircut, as well as the tenth and ninetieth percentile, for each asset class, one at a time. You will see that the median haircut has been very stable for most asset classes. There are a few exceptions, mainly those asset classes for which the dollar volume is very small, like collateralized debt obligations (CDOs). The median haircut for CDOs was 5 percent early in the sample but was as high as 15 percent in June 2015. The ninetieth percentile for that asset class has increased from 8 percent to 25 percent.
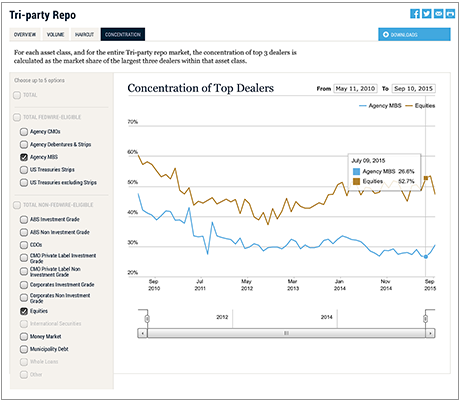
Finally, you might ask about the concentration of collateral among dealers. Good question, because the risk of fire sales, should a large dealer become under stress or default, is greater if the market is more concentrated. Concentration has decreased for most asset classes, which should reduce the risk of fire sales to some extent. That said, there are large differences in concentration among different asset classes. Concentration in agency mortgage-backed securities (MBS) has decreased from close to 50 percent early in the sample to less than 30 percent recently. Concentration in equities has also decreased overall, from 60 percent early in the sample to approximately 50 percent today, but it has been rising since late 2012. The slider below the chart area lets you focus on a specific day or period. For example, between September 2012 and September 2015, you can see that concentration in agency MBS has been very stable, while the concentration in equities has increased steadily.
There are many other aspects of the repo data that you can explore with the interactive tool. We hope that this new tool will be useful—and entertaining—for everyone who has an interest in the U.S. tri-party repo market.
Disclaimer
The views expressed in this post are those of the authors and do not necessarily reflect the position of the Federal Reserve Bank of New York or the Federal Reserve System. Any errors or omissions are the responsibility of the authors.

Jacob Adenbaum is a senior research analyst in the Federal Reserve Bank of New York’s Research and Statistics Group.

Antoine Martin is a vice president in the Research and Statistics Group.

Susan McLaughlin is a senior vice president in the Federal Reserve Bank of New York’s Markets Group.


 RSS Feed
 Follow Liberty Street Economics
Very + data development.