You walk into a bank branch, check in hand. You find yourself in a well-lit space with modern furnishings, and you help yourself to a cup of freshly brewed coffee, courtesy of the bank. Neatly dressed assistants in uniform stand in a row, ready to attend to customers at a moment’s notice, and in fact, one of them approaches you to help you deposit your check. Having finished your business, you leave feeling reassured that such a customer-oriented organization is diligently tending to your hard-earned money. But what could possibly be missing?
Extraneous services and benefits provided by bank branches—a welcoming environment, convenient location, and attentive bank representatives—help to increase customer satisfaction. As a customer, you appreciate these services and might become a “loyal” customer of that bank. As a depositor, however, since you did not purchase anything from the bank, you might wonder why it would provide such services to win your loyalty? One answer could lie in the bank’s pursuit of cheaper, more stable funding.
Benefits of Core Deposits
Core deposits by customers in a bank’s local market are a stable, and thus desirable, source of funds for banks. They are also cheaper and less price-sensitive (“elastic”) than other funding sources such as large certificates of deposit (CDs), since core depositors care less about the interest they earn and more about convenience and the services offered by the bank. Banks, therefore, hope to attract core deposits both to lower their funding costs and to reduce liquidity risks (that is, the risk of depositor withdrawals).
Of course, because the supply of core deposits is less interest-rate-elastic than other funding sources, banks have to provide better services to attract more core deposits. Beyond free coffee, these services may include conveniently located branches, a large ATM network, and user-friendly online banking. These nonpecuniary benefits increase depositors’ switching costs (that is, the cost of switching to another bank), making depositors a “sticky” or stable source of funds. The rub, though, is that a bank needs to incur higher operating costs to attract more core deposits, so the tradeoff is between lower interest expenses and lower noninterest expenses.
Do the Data Agree?
This all seems plausible (to us, at least), but does it show up in the data?
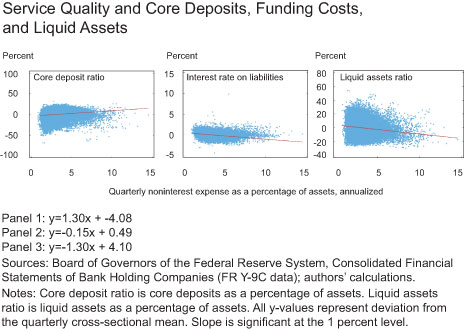
To investigate, we looked at the relationships between a bank’s service quality (proxied by noninterest expenses) and its core deposit ratio, funding costs, and liquid asset holdings. We used regulatory data from 1995 to 2014 and focused on “community banks” (942 banks as of the fourth quarter of 2014) with asset size of less than $1 billion. We measured the scale of service quality using noninterest expenses divided by total assets. As the charts below demonstrate, a higher noninterest expense profile is associated with more core deposits, lower funding costs, and fewer liquid assets. One interpretation, consistent with our reasoning above, is that a bank that provides better services attracts more core deposits, lowers its funding costs, and, because it faces lower liquidity risk, holds fewer liquid assets.
Are They Also Lending Better?
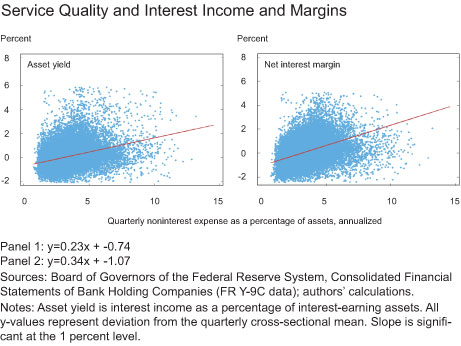
Since the more service-oriented banks hold fewer liquid assets, they must be doing more lending. So, do “services” also help promote bank profitability by widening interest margins? Do they even improve asset performance by allowing more investments in “infrastructure” (for example, more loan officers)? In fact, higher noninterest expenses are significantly and positively associated with higher interest income and higher net interest margins (see chart below).
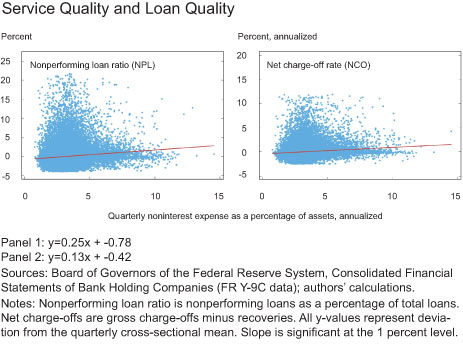
But could this high interest income be a result of better underwriting, or simply higher risk-taking? It seems to be the latter; as shown below, higher operating costs are positively related to nonperforming loans (NPL) and net charge-offs (NCO).
Cheaper Funding but Riskier Lending. What Are We Missing?
So it seems that banks with higher operating costs do attract more core deposits and pay less for their funding, but they also make lower-quality loans, on average. How can we reconcile these findings? Of course, our analysis only documents correlations and more careful study is required for definitive conclusions. For example, there could be reverse causality; perhaps high levels of nonperforming loans are causing higher operating costs owing to the costs of additional loan monitoring and time spent restructuring (see this paper for some evidence). Or our simple bivariate comparisons may be omitting other important variables that are associated with operating expenses and loan losses.
That said, it is still curious that banks with lower funding costs seem to have riskier loan portfolios. If this correlation is robust, we suspect that in the end it might be driven by lax market discipline. Because core deposits are stickier, they may be less sensitive to bank risk-taking, either because they are insured or because the services provide nonpecuniary benefits as well as increase depositors’ switching costs. Weak market discipline means banks could be taking more risks on the asset side while paying less for their funding. Your loyalty might not come for free.
Disclaimer
The views expressed in this post are those of the authors and do not necessarily reflect the position of the Federal Reserve Bank of New York or the Federal Reserve System. Any errors or omissions are the responsibility of the authors.

Dong Beom Choi is an economist in the Federal Reserve Bank of New York’s Research and Statistics Group.

Ulysses Velasquez is a senior research analyst in the Group.


 RSS Feed
 Follow Liberty Street Economics
On your question of reconciling those factors, I think it is worth noting that most retail and commercial bankers that drive core deposit growth also have loan goals. Growing a loan portfolio in a slow economy is tricky. To beat competition, commercial lenders often sacrifice on loan structure (loan term, recourse, collateral) and pricing. Sacrificing on loan structure is synonymous with taking on more risk. Many banks have been successful at developing a strong core deposit base but invested heavily in employees to do so. Those same employees who grew the deposits had trouble hitting their loan growth numbers without increasing the risk profile of the loan portfolio. A good example of that is the former National City Bank of Cleveland, which would eventually be acquired by PNC in a distressed, government brokered sale. National City had an enviable deposit franchise but a risk profile that eventually caused its demise.
I’d like to see the model in which deposit insurance leads to more risk to bank equity holders and how this squares with banks’ excess reserves even if they do earn .5%.
Excellent article. Please say there’s going to be a Part 2.