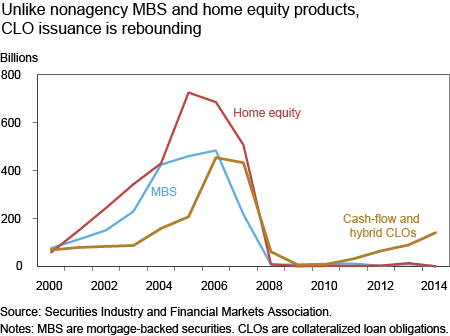
Unlike mortgage-backed and home equity-backed securities, collateralized loan obligations (CLOs), whose collateral is predominantly corporate loans, are slowly but steadily recovering. This revival, illustrated in the chart below, spotlights again a sector of nonagency structured finance that has been scrutinized for its investment practices. This post investigates the trading activities of CLO collateral managers. Understanding their investment strategies is crucial to assessing their effectiveness as financial intermediaries, including their role in financing leveraged buyouts, corporate recapitalizations, project finance, and their impact on bank loan underwriting standards. It is also relevant to the recent debate concerning the potential perils of the reemergence of CLOs.
The collateral in a typical CLO consists of mostly syndicated business loans (such as leveraged loans), and a smaller fraction of corporate bonds and other asset-backed securities. To measure the trading activities of collateral managers, we use information from Moody’s CDO Research Service that details all asset holdings of CLOs compiled from monthly trustee reports. We focus on a homogeneous sample of cash-flow CLOs, whose leveraged loan and bond collateral is more actively managed; we exclude synthetic CLOs that use complex credit derivatives to generate cash flow.
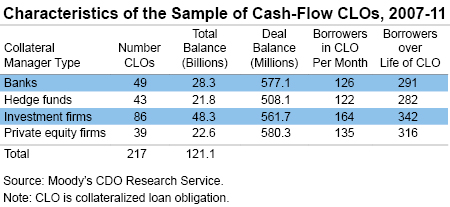
CLOs are managed by four broad categories of intermediaries: banks (including a few insurance firms), hedge funds, investment firms, or private equity firms. Overall, our sample includes 217 CLOs with a total original balance of about $121 billion (see table below). The average CLO invests in a portfolio of debt securities of about 140 borrowers with a total principal balance between $500 million and $600 million. CLOs hold a handful of debt security positions per single corporate borrower (72 percent of the positions represent a single-security holding and 22 percent represent a holding of two securities by the same borrower). We aggregate all security holdings at the borrower level so we can measure more accurately portfolio adjustments to mitigate credit risks or exploit other investment opportunities. This approach aims to capture changes in the aggregate amount invested in a single borrower but ignores other security-specific adjustments.
Trading Turnover
Managers’ trading activity following a CLOs launch is particularly heavy during the warehousing phase when the manager is building the portfolio. However, as we will see below, managers continue to trade actively well beyond this “ramp-up” period.
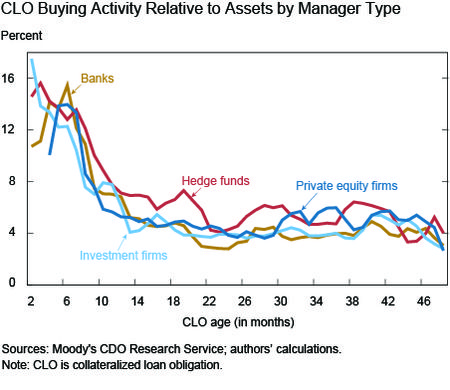
The chart below confirms that buying is more intense during the ramp-up period, but that buying continues as the CLO transitions into its reinvestment phase. Average monthly buying turnover (relative to assets) over the four-year life horizon of the CLO is about 5.5 percent (corresponding to a 66.5 percent annual rate). Note that CLOs managed by hedge funds exhibit higher buying intensity.
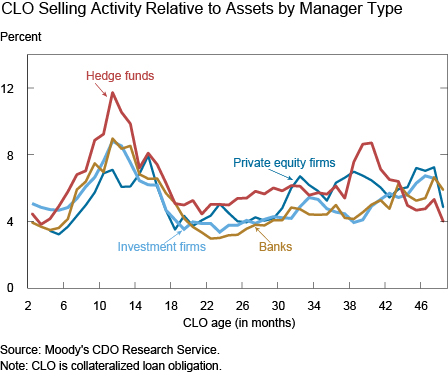
The next chart traces CLO selling activities (relative to assets). To be sure, it is not easy to fully distinguish reinvestment trading from ramp-up purchases or to determine the effective date at which the proceeds are fully invested and all covenants are in place. While some of the trades over the life of a CLO may stem from loan repayments, these compulsory transactions do not seem to be enough to explain the level of selling depicted below, indicating that trading is mostly driven by collateral managers’ discretion. The chart also shows that CLOs managed by hedge funds have greater selling activity, suggesting that hedge fund managers prefer higher portfolio turnover and are keener to take advantage of investment opportunities.
Given the substantial buying and selling by CLO managers, it is interesting to see how this trading turnover changes the composition of a collateral portfolio over time. The chart below shows the fraction of the original borrowing firms that remains in the CLO from its launch date. On average, by the end of the second year since launching, CLO managers have sold about 30 percent of their original investments. While bank CLO managers typically have lower buy or sell trading rates, they have slightly higher divesture rates than other CLOs.
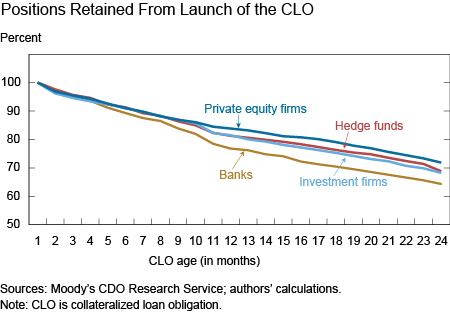
Given that they do not receive any fund inflows and are not exposed to redemptions, our findings reveal that CLOs experience surprisingly high portfolio turnover. While collateral managers are expected to manage credit-risk and interest-rate exposures, their active trading may be motivated largely by arbitrage opportunities. This finding has mixed implications. On the negative side, CLO managers may have less incentive to monitor the corporate borrowers they invest in than do buy-and-hold institutional investors in the syndicated loan market. The higher-than-expected turnover also raises the specter of potential conflicts of interest between CLO managers and investors. On the positive side, the willingness to trade by collateral managers enhances liquidity in the secondary loan market and facilitates price discovery and market efficiency.
Disclaimer
The views expressed in this post are those of the authors and do not necessarily reflect the position of the Federal Reserve Bank of New York or the Federal Reserve System. Any errors or omissions are the responsibility of the authors.
 Stavros Peristiani is an assistant vice president in the Federal Reserve Bank of New York’s Research and Statistics Group.

João A.C. Santos is a vice president in the Research and Statistics Group.


 RSS Feed
 Follow Liberty Street Economics