The rise in oil prices from near $30 per barrel in 2000 to around $110 per barrel in mid-2014 was a dramatic reallocation of global income to oil producers. So what did oil producers do with this bounty? Trade data show that they spent about half of the increase in total export revenues on imports and the other half to buy foreign assets. The drop in oil prices will unwind this process. Oil-importing countries will gain from lower oil bills, but they will also see a decline in their exports to oil-producing countries and in purchases of their assets by investors in these countries. Indeed, one can make the case that the drop in oil prices, by itself, is putting upward pressure on interest rates as income shifts away from countries that have had a relatively high propensity to save.
One measure of petrodollars is the total export earnings of oil-exporting countries, as defined by the International Monetary Fund (IMF), found in the IMF’s Direction of Trade database. As of mid- 2014, when oil prices were near their peak, exports from these countries totaled $2.2 trillion. This was quite a change from 2000 when exports were only $0.4 trillion. The chart below shows a tight connection between these two factors, with the simple regression line finding that a $10 increase in oil prices has been correlated with a $200 billion increase in export revenue.
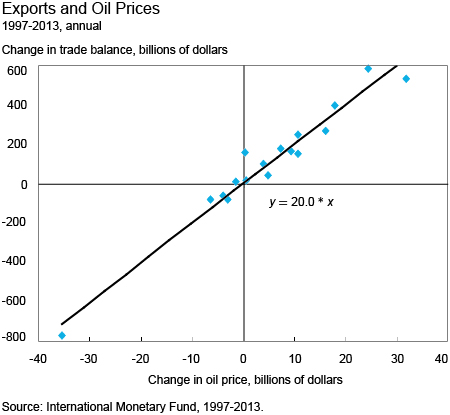
Oil-exporting countries used much of the increase in export revenues to buy more imported goods, with these purchases rising from $0.2 trillion in 2000 to $1.4 trillion in mid-2014. The increase came in roughly equal measure from advanced and other emerging market economies, with a $200 billion jump in purchases from China and the euro area and a $100 billion increase in purchases from the United States. Japan is notable in that its export sales increased by only $30 billion, even though its imports from the oil-exporting countries increased $125 billion. A simple regression like the one above has a $10 increase in the price of oil correlated with $70 billion increase in imports of goods by oil-exporting countries.
Oil revenues were also spent on imported services and transfers to the rest of the world. The current account, as the broadest measure of the trade balance, captures these flows and so gives a fuller account of how much was recycled through trade and transfers. The chart below plots changes in the current account balances of oil exporters against oil prices, with the regression line indicating that a $10 change in oil prices has tended to improve the current account balance by roughly $100 billion.
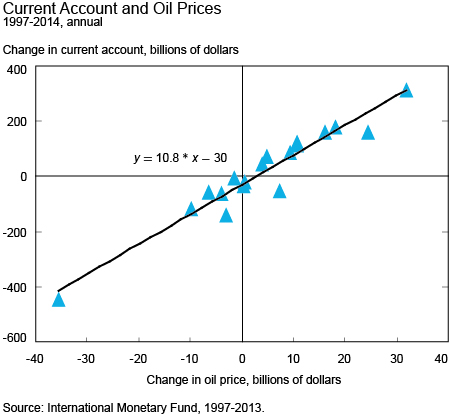
The finding that around half of the increase in export revenues of oil-exporting countries was spent on imports of goods and services plus transfers means that the other half was used to buy foreign assets. That is, the earnings that are not spent or gifted are surplus that must be loaned back to the rest of the world through purchases of foreign assets. So, the above correlation means that roughly half of the change in revenue of oil-exporters was recycled through banks and financial markets. IMF data report that oil-exporting countries lent $500 billion to the rest of the world, as measured by the sum of their current account balances, in 2013 and around $400 billion in 2014.
So what happens to the petrodollar recycling process with the collapse in oil prices? A very rough guess can made using the above correlations. Say the price of oil in 2015 is $50 lower than 2014’s average price of $100. The estimates above suggest that total export revenues flowing to oil-exporting countries will fall by around $1 trillion, with a $500 billion drop in the demand for foreign goods and services along with fewer transfers and a $500 billion drop in the purchases of foreign assets. The correlation noted above suggests a fall in imports of goods from $1.3 trillion to $900 billion. An across-the-board decline of this magnitude would lower euro area exports to oil-exporters by $90 billion, those from China by $60 billion, and U.S. sales by $40 billion. Note that this is a crude calculation and does not consider that countries will likely use the drop in their oil import bill to buy other imported goods, suggesting that the loss of exports of oil-importers might be considerably smaller.
How the drop in demand for foreign assets by oil-exporting countries will play out is more difficult to flesh out. With high oil prices, a substantial amount of global income was flowing to countries with a low propensity to consume, boosting global saving as a share of income. The chart below has global saving and investment spending, as calculated by the IMF. For the world as a whole, saving must equal investment spending, with interest rates and asset prices moving to keep them in balance. (Statistical discrepancies cause measured saving to be greater than measured investment spending.) The chart shows global saving as a share of GDP has been high and stable, with a steep drop in 2008 and a subsequent recovery.
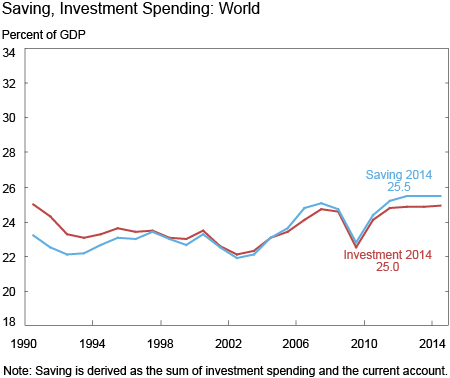
The next two charts break down the data into advanced and emerging market countries. The global saving data masks the step down in saving in the advanced economies and the upward trend in saving in the emerging economies, with the rise from 2000 to 2007 owing largely to more saving in Asia and the oil-exporting countries. The 2008-09 fall in oil prices did trigger a steep decline in saving by oil-exporters, but total saving in emerging market countries was held up by steady Asia saving, particularly in China. The saving surpluses from these two groupings put downward pressure on global interest rates to keep the world’s investment spending high enough to absorb the saving flowing out of these countries.
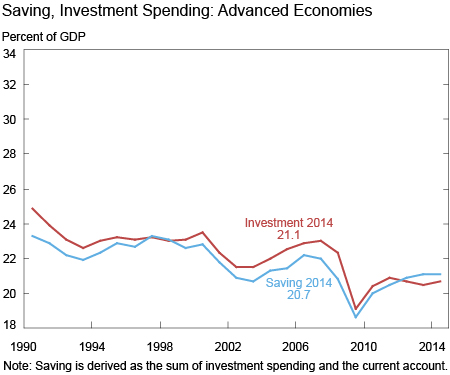
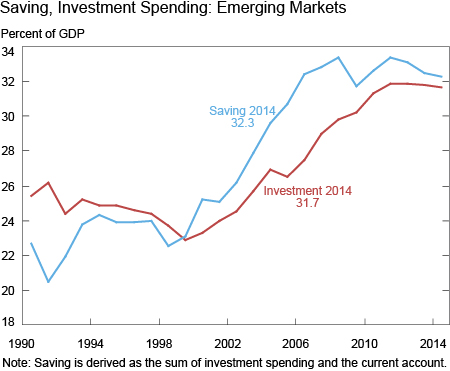
One can argue that the drop in oil prices will lower global saving in 2015 because it shifts income away from oil-exporting countries that have had a relatively high propensity to save. There are many factors affecting global saving and investment spending, such as monetary and fiscal policies, demographics, and productivity. Considered by itself, though, the drop in oil prices will put downward pressure on global saving and lead to higher interest rates than would otherwise be needed to get global saving to equal investment spending.
Disclaimer
The views expressed in this post are those of the authors and do not necessarily reflect the position of the Federal Reserve Bank of New York or the Federal Reserve System. Any errors or omissions are the responsibility of the authors.
Thomas Klitgaard is a vice president in the Federal Reserve Bank of New York’s Research and Statistics Group.
Patrick Russo is a senior research analyst in the Bank’s Research and Statistics Group.


 RSS Feed
 Follow Liberty Street Economics
In your chart annotations for the last 2 diagrams you mention “saving is defined as investment spending + current account”. Say, an Opec earns $100, $60 of which is spent in imports from China/EU/US and $30 in overseas investments. $10 will need to be invested in buying treasury or similar financial instrument (hopefully to mitigate erosion in value). All these will (proportionately?) fall with falling oil prices. See the other side of the coin, because operating costs for most global firms will fall, the resulting savings will be available for investments that would have otherwise come from this Opec. Net change is not much then, even though demand for goods will fall from OPEC ‘X’ depending on elasticity of that demand