Most of our previous discussion about high levels of student loan delinquency and default has used static measures of payment status. But it is also instructive to consider the experience of borrowers over the lifetime of their student loans rather than at a point in time. In this second post in our three-part series on student loans, we use the Consumer Credit Panel (CCP), which is itself based on Equifax credit data, to create cohort default rates (CDRs) that are analogous to those produced by the Department of Education but go beyond their three-year window. We find that default rates continue to grow after three years and that performance by cohort worsened in the years leading up to the Great Recession.
In order to create our cohort default rates, we must first assemble a history of default experiences at the borrower level. First, we identify the subsets of borrowers who are currently in default, which is defined as being 270 or more days past due. We then identify borrowers who have ever defaulted. As of the fourth quarter of 2014, 11 percent of all borrowers were in default, with an additional 7 percent of borrowers having defaulted in the past. Another 6 percent of borrowers were in earlier stages of delinquency, but not yet defaulted; fully 37 percent of borrowers had at least one missed payment on their credit report.
We next assign our borrowers to cohorts using loan origination information on the academic year in which the student stopped taking on new loans. This information allows us to assign each borrower to an “origination completion cohort” for each academic year. Our data do not provide information on graduation or dropout dates, but to the extent that student borrowers take out new loans in the last year of their education, this approach will be close to the concept of the school-leaving cohort of each student borrower. Note that our measures include federal PLUS and Perkins loans as well as private loans.
Cohort Default Rates—Nine Years Out
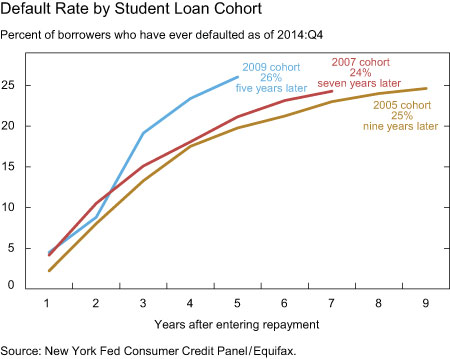
We can now produce default rates by this cohort breakdown. In our calculations, the denominator is the number of borrowers who entered repayment during a specific cohort year and the numerator is the number of borrowers from that cohort who have ever defaulted on their loan since they entered repayment. The chart below shows our calculations for the 2005, 2007, and 2009 cohorts. Roughly one quarter of each of the cohorts has defaulted as of the fourth quarter of 2014. Note that the default rate of the 2009 cohort has surpassed that of the earlier cohorts much more quickly. In fact, the chart shows a pronounced worsening of the cohort default rate schedules over time. CDRs at all durations are higher for more recent cohorts, with only one exception being the two-year default rate of the 2009 cohort. This exception should be interpreted with caution, however, as it was the sole data point affected by uneven credit reporting in 2011.
Keep in mind that we haven’t seen the full picture of 2009 borrowers who will default. Our calculations indicate a 19 percent three-year default rate for this 2009 cohort; but two years later, an additional 7 percent of borrowers have defaulted. The pattern for earlier cohorts strongly suggests that this rate will continue to rise. Our 2005 cohort had a three-year default rate of 13 percent—but this is only half of the defaults that we see nine years out.
Who is defaulting?
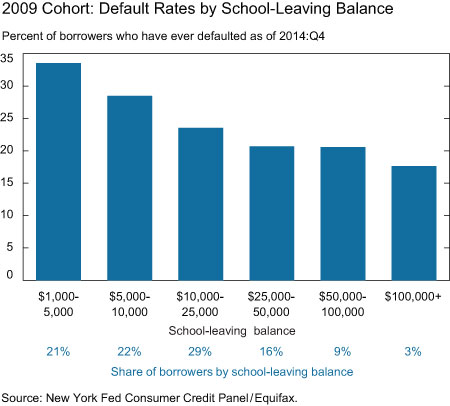
CCP data show that early delinquencies are worse among lower-balance borrowers, and that’s true for default rates, too. The results for the 2009 cohort, presented in the chart below, are striking: the highest default rates, at nearly 34 percent, are among the borrowers who owe less than $5,000. These borrowers made up 21 percent of the 2009 cohort. The default rate among the borrowers who leave school with more than $100,000 in debt is almost 50 percent lower, at 18 percent.
Conclusion
Our analysis of borrower distress uncovers some new facts. Perhaps most important, cohort default rates appear to have been worsening over time, and the two- and three-year analyses that feed much of the public discussion are only part of the story. CDRs continue to rise in years four through nine. Second, defaults appear to be concentrated among the lowest-balance borrowers, who may not have completed their schooling, or may have earned credentials with lower payoffs than a four-year college degree. Finally, snapshots of delinquency and default rates miss the fact that many borrowers who are current today have had serious stress in the past. Only about 63 percent of borrowers appear to have avoided delinquency and default altogether.
In our next post, we’ll discuss how quickly these borrowers have been paying down their balances. We will find that many borrowers who have avoided defaulting are still struggling to pay off their debts.
Disclaimer
The views expressed in this post are those of the authors and do not necessarily reflect the position of the Federal Reserve Bank of New York or the Federal Reserve System. Any errors or omissions are the responsibility of the authors.

Meta Brown is a senior economist in the Federal Reserve Bank of New York’s Research and Statistics Group.

Andrew F. Haughwout is a senior vice president in the Bank’s Research and Statistics Group.

Donghoon Lee is a research officer in the Bank’s Research and Statistics Group.

Joelle Scally is the administrator of the Center for Microeconomic Data in the Bank’s Research and Statistics Group.

Wilbert van der Klaauw is a senior vice president in the Bank’s Research and Statistics Group.


 RSS Feed
 Follow Liberty Street Economics
Of those that default–what fraction ultimately resume repayment? Large loan balances are more likely to be owed for expensive professional degrees, such MDs, which enable the individual to earn substantial income. In determining whether or not to deny loans based on certain criteria–e.g. need for remedial coursework, ex prisoners, one should also consider whether there are a large number or even a majority who benefit from the loans but do not default.
Thanks to our commenters for raising a number of interesting issues. To Raymond: Thank you for sharing your experience from the front lines, which nicely conforms to what we have found in our data. You may be interested in a speech that our Director of Research gave recently, which touched on some of these issues: http://www.ny.frb.org/newsevents/speeches/2015/mca150205.html To Mossup: Our data is a panel of representative anonymous loans, and we see the loan status as of the end of each quarter, therefore, we can see any previous default without any imputation. To the extent that erroneously reported defaults have been corrected by the end of a quarter, they will not be counted. To morelipstick4pigs: Unfortunately our data do not indicate the level of education for which a loan is obtained so we are unable to distinguish between undergraduate vs. graduate vs. parent loans, but in future analyses we plan to disaggregate by age to obtain further insight into this potentially important variation. To Andy: We wish our data had an indicator of federal vs. private loans too. Unfortunately, we are not able to compare the relative performance of federal vs. private loans due to the absence of that information.
This is not surprising. I work in financial aid at a large public community college. We pulled data on our defaulters and we found over 60% started with remedial coursework and borrowed their first and second terms. About 80% of the total data population suspended soon after the second term – thus the low amounts. Many were not students just out of high school, they were independent adults. Putting this altogether with the many years I’ve been in financial aid speaking with students I’ve come to a conclusion. 99% of the time when I have a student that has been suspended asking for loans and I mention private or alternative loans they immediately say they don’t have good credit. Bad credit seems to correlate with bad academics. Many seem concerned more with paying bills than paying education. Sometimes they are just out of jail and no one will hire them. Their probation requires they work or get a job which the later is nearly impossible. Other times we have people so deep in the hole in debt already that the student loans was a way to buy more time. The word is out if you have bad credit and are desperate for funds just go to a community college where tuition is low and borrow the maximum. We noticed in our data pull many students graduated from high school or received their GED up to 10 years ago or more! Want the defaults to go down – stop lending to students that have a significant number of remedial courses their 1st and 2nd terms at a college where tuition is already low
For CDRs, default occurs at 361 days delinq. And how does CCP filter out accounts erroneously reported as defaulted and then corrected? Or are those still in the “ever defaulted” category? It is implausible that 7 percent of borrs who currently have open nondefaulted accounts have a past default. Loan rehabilitation removes the default from the credit record. One could impute the existence of a previous default from the delinq reporting but this would not be very accurate as a measure. The rehab rate also couldn’t be that high and the rehab redefault rate couldn’t be that low.
The student debt is an aggregate number which needs to be dis aggregated by graduate debt versus baccalaureate or associates debt, and then break that debt down by size. This data sifting could be expected to reduce not just the overall average but also impacted distribution student debt by age cohort. A study by National Center for Education Statistics reported that in the year 2013 and 2012 graduate student debt was composed of 16 to 18% of the total debt. My favorite story illustrating the need to separate student loan data by degree is from the OWS interviews, where a cohabitating couple explained that they were in a graduate program for their Master’s degree from the Ivy League university and were afraid of the prospect of eating beans for the next 10 years because of their debts, expressing a breathtaking expectation of entitlement, indolence, total financial naiveté when they signed the papers.
Those are the years when underwriting of private loans had loosened significantly and their lending practices actually became higher-risk than the demographics of the federal loans, which were predominantly going to students at low-risk colleges at that point. During this period shareholders and investors were questioning the high forbearance and chargeoff rates of private loans; news articles and 10Qs document these trends. Students also did not have to get approval from financial aid offices to get a private student loan. Direct marketing was significant. How much of these ‘default rates’ were students who didn’t get a federal or federally guaranteed loan? Thanks.