Do riskier banks have more capital? Banking companies with more equity capital are better protected against failure, all else equal, because they can absorb more losses before becoming insolvent. As a result, banks with riskier income and assets would hopefully choose to fund themselves with relatively more equity and less debt, giving them a larger equity cushion against potential losses. In this post, we use a top-down stress test model of the U.S. banking system—the Capital and Loss Assessment under Stress Scenarios (CLASS) model—to assess whether banks that are forecast to lose capital in a severe downturn do indeed have more capital, and how the relationship between capital and risk has evolved over time.
The CLASS Model
The CLASS model generates projections of commercial bank and bank holding company (BHC) income and capital under different macroeconomic scenarios. As we described in an earlier post, the projections are based on statistical models of bank income, expense, and loan performance, combined with assumptions about provisioning, dividends, asset growth, and other factors. These projections can be used to assess how much firms’ capital ratios might fall in a stressed economic environment.
The particular stressed economic environment we examine here is a rerun of the 2007-09 financial crisis—a “crisis redux” scenario, in which key macroeconomic and financial variables, such as the unemployment rate, economic growth, interest rates, and housing and stock prices, are assumed to evolve as they did from the third quarter of 2007 onwards. We use the CLASS model to project capital under this scenario, based on data on the financial condition of U.S. BHCs and commercial banks as of the third quarter of 2013. This point is the same “as of” date as the stress tests generated by the Federal Reserve for the 2014 Comprehensive Capital Analysis and Review (CCAR) and Dodd-Frank Act Stress Test (DFAST).
We compute these projections for each of the 200 largest U.S. banking companies. We interpret the projected change in each banking firm’s capital ratio over the course of the scenario as a measure of its exposure to macroeconomic risk. The sensitivity of net income and capital to macroeconomic conditions varies significantly across banks, due to differences in their income-generating activities and asset mix. For example, a bank holding mainly short-term Treasury bills is much less exposed to the business cycle than is one with a large portfolio of construction and land development loans, all else equal. The CLASS model incorporates information on asset mix with the result that the more sensitive the bank’s net income and capital are to adverse macroeconomic conditions, the more negative the change in capital will be over the course of the crisis redux scenario.
A “Precautionary” Relationship between Capital and Risk in 2013
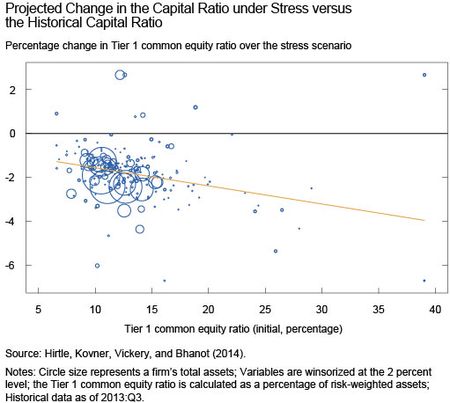
The chart below plots the projected change in the capital ratio for the 200 largest banking firms under the crisis redux scenario against the last historical value (2013:Q3) of each company’s capital ratio. Each firm’s result is represented by a circle on the chart; the size of the circle reflects the firm’s asset size. The red line is a simple line of best fit between the change in the capital ratio and its starting value. The capital ratio shown is the ratio of Tier 1 common equity (common equity minus goodwill and certain other intangibles) to risk-weighted assets.
As the chart shows, although there is a lot of variation, capital declines more under stress for the most highly capitalized firms, indicating that such firms have the riskiest assets and income-generating activities. We find that this inverse relationship is statistically significant in formal statistical tests, either when treating each BHC and bank equally in computing the correlation, or weighting the companies by asset size.
What’s the takeaway? This inverse relation is consistent with a “precautionary” view of bank capital structure, as discussed in academic studies such as Berger et al. (2008). This view suggests that banking firms with riskier income will endogenously choose to hold a larger capital buffer to reduce the likelihood of becoming undercapitalized. In contrast, if moral hazard or risk-shifting concerns are dominant (Acharya, Le, and Shin 2014, Berger and Bouwman 2013), we would expect the opposite correlation—undercapitalized banks would have incentives to hold riskier assets because, beyond the point of insolvency, downside risks are borne by debtholders rather than shareholders. A finding that the least-well capitalized banks also have the riskiest assets and income would be worrisome from a financial stability perspective. The CLASS model results are not consistent with this “moral hazard” view of capital and risk in the banking system, however, at least as of 2013.
Banking firms may not always have taken the precautionary approach to capital
As a next step, we look back historically to assess whether projections based on less recent banking data are also consistent with a precautionary view of bank capital. The U.S. banking industry experienced significant turmoil during the 2007-09 financial crisis, which resulted in the introduction of supervisory stress testing and other changes to the regulatory environment. In particular, the Federal Reserve introduced the CCAR, which fundamentally altered the supervision of capital adequacy and capital planning for large U.S. BHCs.
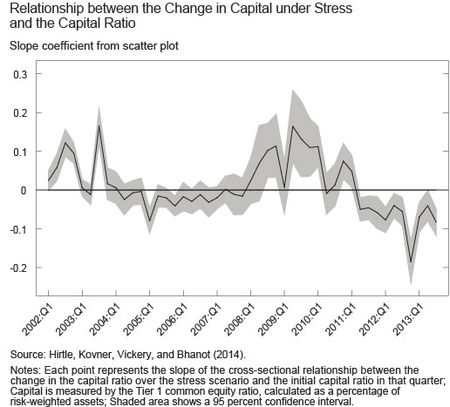
Once again, we use the CLASS model to evaluate how the relationship between capital and asset risk in the banking system has evolved over time. The chart below plots the slope of the relationship between initial capitalization and the change in the capital ratio over the stress scenario measured at each point in time since 2002. To construct this figure, we first use the CLASS model to compute projections of Tier 1 common equity under the crisis redux scenario for each of the 200 largest BHCs and banks in each quarter between 2002:Q1 and 2013:Q3. We then regress the change in the capital ratio under stress on the initial capital ratio in each individual quarter over this period. The chart plots the time-series evolution of the slope coefficient from that regression (the solid line) along with the 95 percent confidence interval (the shaded area). A negative value indicates that firms with capital ratios that decline sharply under the stress scenario also have higher starting capital ratios, while a positive value indicates the reverse. The last point on the line graph is thus the slope of the line of best fit from the scatter plot shown earlier. (Note that both this chart and the scatter plot are taken from our research paper on the CLASS model, so please see that paper for more details.)
Since 2011, banking companies with assets and income that are highly exposed to the crisis redux scenario also have higher capital ratios, consistent with the earlier scatter plot. However, this was not true prior to 2011. During the 2008-10 period, such “exposed” firms were actually less well capitalized, likely reflecting the fact that large losses experienced during the crisis had depleted their capital ratios. Prior to 2008, the relationship was either positive or at best weakly negative, suggesting that the precautionary view of capital did not dominate in the pre-financial crisis period. The results suggest that there has been a marked shift in capital planning by banking firms since the financial crisis.
Why have banking firms’ capital policies become more precautionary?
This evidence that banks’ capital policies have become more precautionary in recent years is encouraging from a financial stability point of view. One possible explanation for why capital policy has evolved, at least for the largest firms, is the implementation of annual supervisory stress tests by the Federal Reserve, which are explicitly designed to ensure that all firms remain well-capitalized even under a severe macroeconomic downturn. Other changes since the financial crisis, such as improved risk management, greater awareness of downside risks, or changes in supervisory practices, may also have affected capital planning policies, especially among banking firms with riskier portfolios. While beyond the scope of this post, investigating these issues in more detail would be an interesting topic for future research.
Disclaimer
The views expressed in this post are those of the authors and do not necessarily reflect the position of the Federal Reserve Bank of New York or the Federal Reserve System. Any errors or omissions are the responsibility of the authors.
James Vickery is a research officer in the Federal Reserve Bank of New York’s Research and Statistics Group.
Anna Kovner is a research officer in the Bank’s Research and Statistics Group.
Beverly Hirtle is a senior vice president in the Bank’s Research and Statistics Group.


 RSS Feed
 Follow Liberty Street Economics
I recently read an article about the increasing role of naysayers in banks. To be more precise, officers from departments like compliance, law, or risk management, only used to be a part of discussions made in the banks. However, following the crisis they have become more and more dominant, and today discussions are generally over when they simply say “no”. With higher regulatory standards the banking business will definitely move into the right direction. And this “precautionary approach” to hold capital would be a good sign.