On January 29, 2014, the U.S. Treasury held its first auction of a two-year floating-rate note (FRN), which pays a fixed spread over the floating thirteen-week bill rate rather than a fixed coupon. In this post, we investigate the aftermath of the January auction and highlight the important role played by dealers as intermediaries and by money market funds as ultimate investors. For more details on the FRN terms, please see our previous post, which offered an introduction to FRNs.
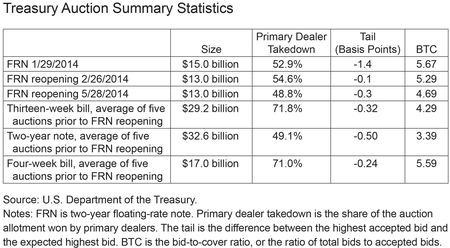
We discuss auction participation and interest along several dimensions: the auction “takedown,” the bid-to-cover ratio, and the auction tail. Auction takedown is simply how much of the auction allotment a particular group of participants ended up winning. For example, if the primary dealers “took down” 50 percent of a $15 billion allotment, that means the primary dealers as a group bid for and were awarded $7.5 billion in the newly auctioned security. The bid-to-cover (BTC) ratio measures the ratio of total bids to accepted bids. If total bids for the same $15 billion allotment described above were $45 billion, the BTC would be 45/15=3.00. Lastly, the auction tail is simply the difference between the highest accepted bid (in other words, the lowest yield at which there are buyers for the entire allotment) and the expected highest bid, usually taken as the secondary market when-issued bid side yield at the time of the auction close. In auction terminology, “stopping through” means that the highest accepted bid was lower than the expected bid, showing more interest than expected. If an auction “tails,” then the highest accepted bid was higher than the expected bid, indicating lower-than-expected demand.
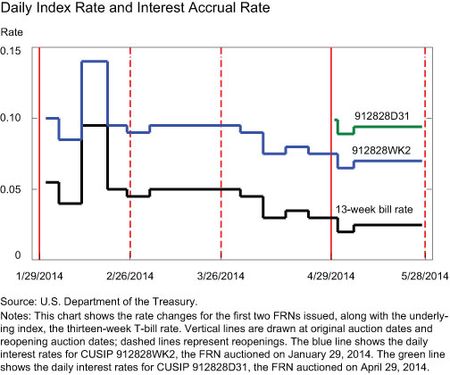
The first FRN auction closed with a discount margin of 4.5 basis points, stopping out 1.4 basis points through the when-issued bid of 5.9 basis points, indicating stronger-than-expected demand. With the most recent thirteen-week bill rate at 5.5 basis points, this corresponded to an interest rate of a little over 10 basis points. Participation in the first FRN auction was also strong when measured by the takedown by indirect/direct bidders and the high BTC.
In terms of primary dealer takedown, the FRN auctions were very similar to previous two-year note auctions but distinctly different from bill auctions, indicating that, from an investor perspective, the maturity of the note rather than its short duration is the dominant characteristic in determining takedown. Subsequent FRN reopenings in February and March, as well as the second FRN CUSIP auctioned in April, were slightly weaker, with lower BTC, higher primary dealer participation, and barely stopping through the tail, but they remained in line with previous two-year note auctions.
Secondary Market Activity after the First FRN Auction
The chart below shows that following the original FRN auction in January, the daily interest rate earned on FRNs stayed between 5 and 15 basis points. The second CUSIP auctioned stopped at a higher margin than the first auction, perhaps a result of the downward drift in the thirteen-week bill rates.
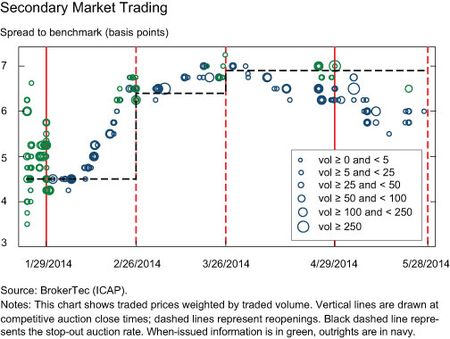
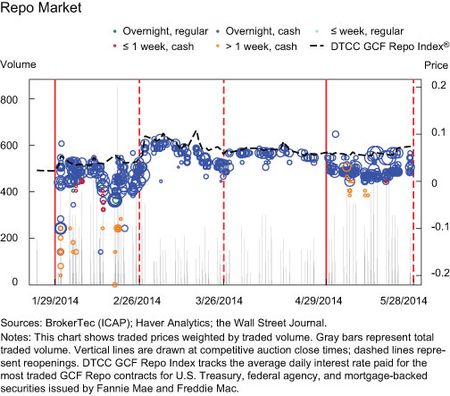
As shown in the charts below, the FRN has seen active trading on secondary markets, both for outrights (the first chart) and repo transactions (the second chart). In both markets, price volatility has been greatest between the original auction and the first reopening. In the repo market, repo rates have tended to follow the general collateral repo rate, except for the period prior to the first reopening, when the FRNs tended to trade “special,” or below the general collateral repo rate, coinciding with a peak in volume between issuance and the first reopening, with cash overnight repos dominating the market.
Primary Dealer Activity
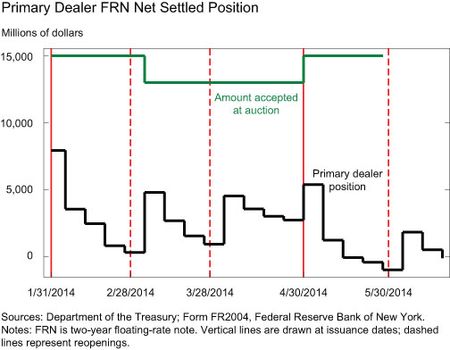
Primary dealers have consistently taken down between one-half and two-thirds of each FRN auction, consistent with the expectation that primary dealers should participate meaningfully in all Treasury auctions. Between auctions, primary dealers act as market makers for the auctioned securities in the secondary market, selling their FRN inventories throughout the month and freeing up balance sheet capacity for the next auction. Their market-making activity can be inferred from the charts below, which show the aggregate weekly net settled FRN positions of primary dealers as reported on form FR2004. The FRN inventories of primary dealers peak around each auction issuance date and gradually approach zero immediately before the next auction. In fact, during the second half of May, primary dealers reported holding negative settled amounts of FRN securities. This suggests the dealers’ shorting of the note in preparation for their participation in the May reopening, thereby allowing dealers to manage post-auction inventories more efficiently. Such a strategy would prove least risky in a familiar market that is perceived as liquid, and hence the negative settled amounts were only observed after the second FRN CUSIP had been auctioned.
Money Market Funds Activity
After each auction, the Treasury releases the breakdown of successful buyers by investor type (see table below). Investment funds and international investors consistently bought the bulk of the FRNs not taken down by primary dealers at auction. This is consistent with the prediction in our previous post, in which we su
ggested that foreign central banks and money market funds would be the most likely ultimate investors, while the yield would be too low to attract depository institutions that can earn interest on excess reserves (IOER) of 25 basis points. As further purchases by these investors in the secondary market following each auction are likely, the numbers in the table provide a reasonable lower bound on the holdings of these investor types. Because most foreign central banks do not publish current foreign currency portfolio holdings at the CUSIP level, we will look only at the evolution of FRN mutual fund holdings since the first FRN issuance on January 31, 2014.
Money market funds (MMFs) are natural holders of FRNs because these securities provide a slight yield pickup over similar duration bills, and many MMFs are well below their weighted-average-life (WAL) caps. Starting in 2010, the Securities and Exchange Commission (SEC) required MMFs to report detailed monthly portfolio holdings using the new Form N-MFP, which can be accessed sixty days after the relevant end-of-month date. As an example, information filed for the end of January 2014 was made public on April 1, 2014.
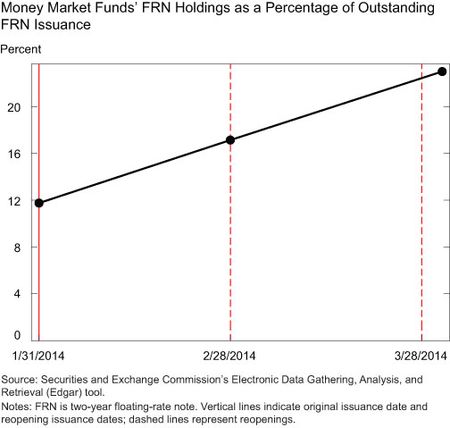
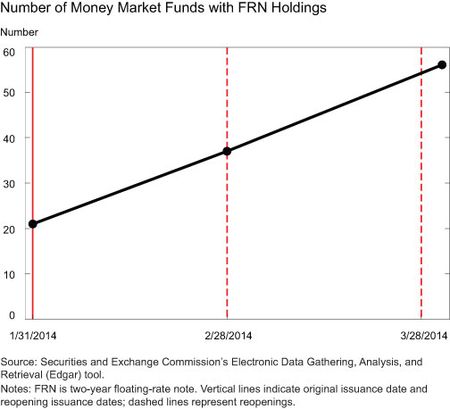
We use the SEC’s Electronic Data Gathering, Analysis, and Retrieval (Edgar) search tool to find MMF holdings of the first FRN (CUSIP 912828WK2). Initially, MMFs were tentative participants in the FRN market, reporting holdings of less than $2 billion as of January 31, or about 12 percent of outstanding FRN issuance, as shown in the first chart below. By February 28, MMFs had increased their share to 17 percent of outstanding notes, holding nearly $5 billion. In the weeks after the first reopening, we saw the entrance of many more funds (as shown in the second chart below), which increased MMFs’ share of FRN holdings to 23 percent.
The behavior and holdings of these firms also vary widely. While 75 percent of firms had holdings of less than $40 million in January and less than $67.5 million in February, a few participants had eye-catching totals. Legg Mason Partners’ combined funds took on nearly $890 million in January and another $575 million in February, for a combined $1.465 billion; one of its associated funds held $475 million in January, while another held $850 million in February. Other big participants included funds advised by Deutsche Bank and Charles Schwab, with Deutsche Bank funds taking on $472 million across funds in January and $150 million in February, and Charles Schwab’s funds taking $150 million in January and $1.405 billion in February. One of Charles Schwab’s funds held nearly $1.1 billion by the end of February. The charts above suggest that, so far, the market has been driven by a few key participants jumping in enthusiastically after the second reopening and has been supported by a group of smaller funds with more conservative holdings. Overall, the significant yield pickup of FRNs over thirteen-week bills seen so far has likely been a key reason why we haven’t observed more widespread participation in the FRN market by MMFs.
Final Words
Domestic MMFs and foreign investors have been important investors in the newly issued FRNs, owing to the low duration and attractive yield pickup over the thirteen-week bills, while depository institutions have largely been absent. At the same time, there has been little sign of the FRN success having come at the expense of the thirteen-week bill, because bill auctions have remained strong. However, it should be noted that the current low-rate environment and the relatively small FRN allotment size mean that the success of the FRNs may differ with a normal yield environment or larger allotment sizes, or both.
Our sources are presented in an appendix.
The views expressed in this post are those of the authors and do not necessarily reflect the position of the Federal Reserve Bank of New York or the Federal Reserve System. Any errors or omissions are the responsibility of the authors.

Ezechiel Copic is a senior associate in the Federal Reserve Bank of New York’s Markets Group.
Luis Gonzalez is a senior associate in the Bank’s Markets Group.

At the time this post was written, Caitlin Gorback was a senior research analyst in the Federal Reserve Bank of New York’s Research and Statistics Group. She is currently a graduate student at the University of Pennsylvania.

Blake Gwinn is an associate in the Bank’s Markets Group.
Ernst Schaumburg is an assistant vice president in the Bank’s Research and Statistics Group.




 RSS Feed
 Follow Liberty Street Economics