Market prices provide timely information on policy expectations. But as we emphasized in our previous post, they can deviate from investors’ expectations of the most likely path because they embed risk premiums and represent probability-weighted averages over different possible paths. In contrast, surveys explicitly ask respondents for their views on the likely path of economic variables. In this post, we highlight two surveys conducted by the Federal Reserve Bank of New York that provide information about expectations that can complement market-based measures.
Ahead of each meeting of the Federal Open Market Committee (FOMC), the Trading Desk of the New York Fed (the Desk) conducts the Survey of Primary Dealers (SPD) and the Pilot Survey of Market Participants (SMP), the results of which are available here. Similar to other surveys, the SPD and the SMP ask respondents for their views on a range of economic and financial variables, including the target federal funds rate. In addition to soliciting these regular forecasts, the Desk’s surveys also ask timely and in-depth questions on the economic and policy outlook that are relevant to policymakers. Unlike most other surveys, the SPD and the SMP focus on forecast distributions in addition to respondents’ views of most likely outcomes.
A Peek into the Details
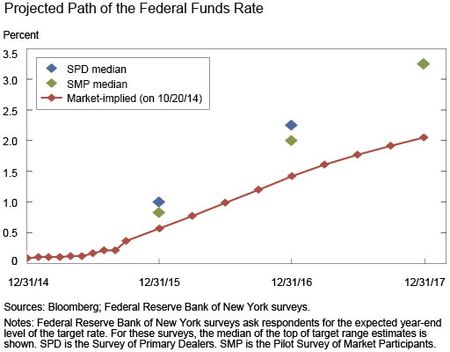
In the Desk’s October surveys, the median of respondents’ projections of the most likely level of the federal funds rate over the next several years is somewhat higher than the market-implied path over the next two years and is much higher three years out, as illustrated in the chart below (note that the SPD and SMP median values are the same in 2017).
Why does the market-implied path differ from the survey-based measures? As we discussed in the previous post, risk premiums embedded in market prices could cause market-based measures to diverge from underlying interest rate expectations. Additionally, market prices are based on probability-weighted average expectations, which can differ materially from the modal, or most likely, expected outcomes. Finally, expectations extracted from market prices may reflect the expectations of a different set of market participants than those captured in survey responses.
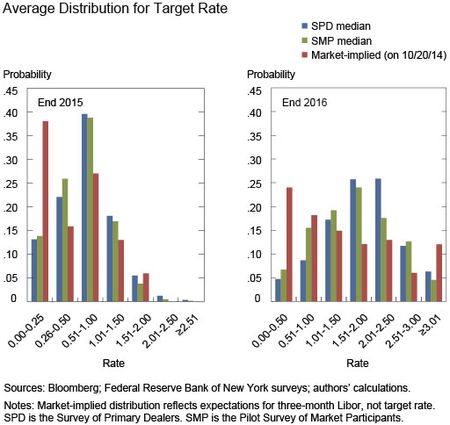
The Desk surveys illuminate the difference between respondents’ modal and mean expectations. Respondents are regularly asked to provide their assessment of the probability distribution for the target federal funds rate at specific points in the future. The average probability distributions for the target federal funds rate from the October surveys, shown below, provide a peek into survey respondents’ perceived balance of risks around their modal paths. In fact, both distributions skew toward a lower rate path, with this skew somewhat more pronounced for SMP respondents.
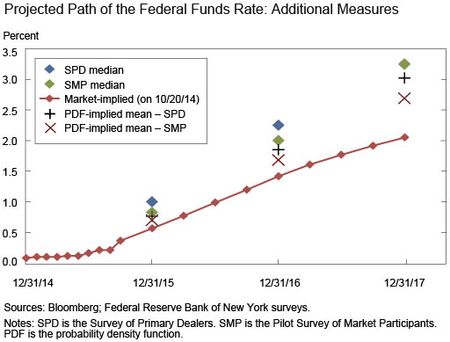
Indeed, the average probabilities assigned by survey respondents indicate a roughly 15 percent chance of the policy rate being at the current range at the end of 2015 and a 40 percent chance of the rate being at or below 50 basis points at that time. As a result of this skewness in the distributions, the average expected rates implied by these distributions (the “PDF-implied means”) fall below respondents’ modal forecast paths. As the projections chart below shows, the PDF-implied means are also closer to corresponding market-based measures.
Before discussing the difference between means and modes further, we note that the two charts above also show the probabilities implied by options on Eurodollar futures contracts (the red bars). Interestingly, the option-implied distributions reflect a higher probability that short-term interest rates will remain at or near the zero lower bound at the end of 2015 and 2016 than the corresponding survey-based measures. This difference relative to survey-based measures is also reflected in the interest-rate-futures-based pricing of the path of the policy rate (see our companion post here for more details).
One of the reasons that survey-based measures of the modal and mean expected path of the policy rate may differ—and may also differ from market-implied measures—is that market participants might anticipate states of the world where the FOMC raises the target rate but then reverses course and, possibly, brings the rate back to the zero lower bound. As discussed in the prior post, because it represents the mean of the full expected distribution, the market-implied path of the policy rate would capture such states of the world, whereas survey-based measures of the modal path may not.
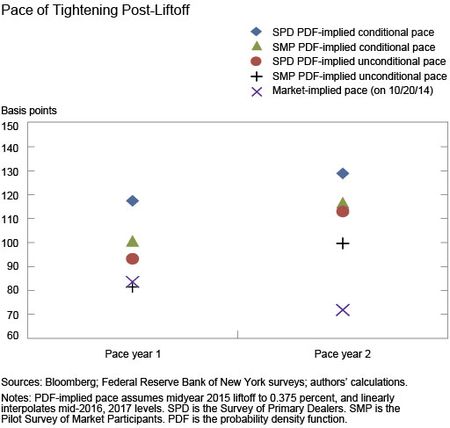
One advantage of the flexibility of the SPD and SMP is that the perceived likelihood of such scenarios can be assessed by adding specific questions to the surveys. In fact, the September and October 2014 surveys specifically asked respondents for their assessment of the probability of returning to the zero bound within two years following liftoff. In both surveys, the median respondent assigned a 20 percent probability to the target rate returning to the zero bound during this timeframe, though responses from SMP participants were slightly more dispersed. Additionally, respondents were asked to assess the probability distribution of the pace of tightening following the first increase in the policy rate, conditional on not returning to the zero lower bound. As shown in the chart below, the conditional expected pace of tightening in the first and second twelve-month periods after liftoff lies above both the unconditional expected and the market-implied pace of tightening.
What might drive survey respondents’ expectations of the policy rate going forward? The Desk collects commentary provided by respondents in the surveys to give context to their forecasts. Survey respondents have highlighted several potential risks to their target rate forecasts, any of which might push their mean expectation below their modal expected path. One is that external macroeconomic factors (e.g., heightened concerns over downside risks to global growth and inflation) might delay the normalization of monetary policy. Respondents have also raised the possibility that following the first increase in the target rate, the Committee may raise rates at a slow pace thereafter.
Disclaimer
The views expressed in this post are those of the authors and do not necessarily reflect the position of the Federal Reserve Bank of New York or the Federal Reserve System. Any errors or omissions are the responsibility of the authors.

Richard K. Crump is a research officer in the Federal Reserve Bank of New York’s Research and Statistics Group.

Emanuel Moench is a research officer in the Bank’s Research and Statistics Group.

William O’Boyle is a financial markets analyst in the Bank’s Markets Group.

Matthew Raskin is an assistant vice president in the Markets Group.

Carlo Rosa is a senior economist in the Markets Group.


 RSS Feed
 Follow Liberty Street Economics