The Rise in Deposit Flightiness and Its Implications for Financial Stability

Deposits are often perceived as a stable funding source for banks. However, the risk of deposits rapidly leaving banks—known as deposit flightiness—has come under increased scrutiny following the failures of Silicon Valley Bank and other regional banks in March 2023. In a new paper, we show that deposit flightiness is not constant over time. In particular, flightiness reached historic highs after expansions in bank reserves associated with rounds of quantitative easing (QE). We argue that this elevated deposit flightiness may amplify the banking sector’s response to subsequent monetary policy rate hikes, highlighting a link between the Federal Reserve’s balance sheet and conventional monetary policy.
Banking System Vulnerability: 2024 Update

After a period of relative stability, a series of bank failures in 2023 renewed questions about the fragility of the banking system. As in previous years, we provide in this post an update of four analytical models aimed at capturing different aspects of the vulnerability of the U.S. banking system using data through 2024:Q2 and discuss how these measures have changed since last year.
The Dueling Intraday Demands on Reserves

A central use of reserves held at Federal Reserve Banks (FRBs) is for the settlement of interbank obligations. These obligations are substantial—the average daily total reserves used on two main settlement systems, Fedwire Funds and Fedwire Securities, exceeds $6.5 trillion. The total amount of reserves needed to efficiently settle these obligations is an active area of debate, especially as the Federal Reserve’s current quantitative tightening (QT) policy seeks to drain reserves from the financial system. To better understand the use of reserves, in this post we examine the intraday flows of reserves over Fedwire Funds and Fedwire Securities and show that the mechanics of each settlement system result in starkly different intraday demands on reserves and differing sensitivities of those intraday demands to the total amount of reserves in the financial system.
Are Nonbank Financial Institutions Systemic?

Recent events have heightened awareness of systemic risk stemming from nonbank financial sectors. For example, during the COVID-19 pandemic, liquidity demand from nonbank financial entities caused a “dash for cash” in financial markets that required government support. In this post, we provide a quantitative assessment of systemic risk in the nonbank sectors. Even though these sectors have heterogeneous business models, ranging from insurance to trading and asset management, we find that their systemic risk has common variation, and this commonality has increased over time. Moreover, nonbank sectors tend to become more systemic when banking sector systemic risk increases.
End‑of‑Month Liquidity in the Treasury Market

Trading activity in benchmark U.S. Treasury securities now concentrates on the last trading day of the month. Moreover, this stepped-up activity is associated with lower transaction costs, as shown by a smaller price impact of trades. We conjecture that increased turn-of-month portfolio rebalancing by passive investment funds that manage relative to fixed-income indices helps explain these patterns.
Reallocating Liquidity to Resolve a Crisis

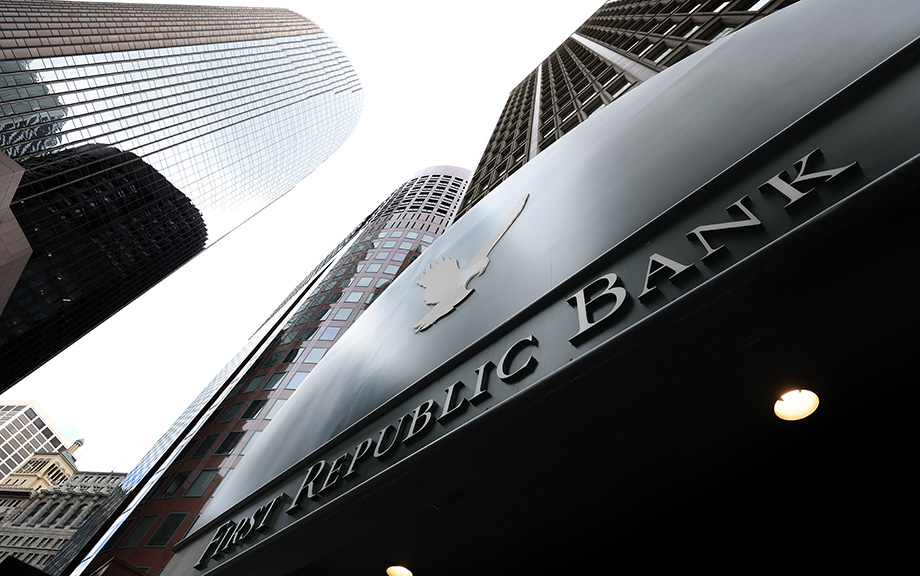
Shortly after the collapse of Silicon Valley Bank (SVB) in March 2023, a consortium of eleven large U.S. financial institutions deposited $30 billion into First Republic Bank to bolster its liquidity and assuage panic among uninsured depositors. In the end, however, First Republic Bank did not survive, raising the question of whether a reallocation of liquidity among financial institutions can ever reduce the need for central bank balance sheet expansion in the fight against bank runs. We explore this question in this post, based on a recent working paper.
Stablecoins and Crypto Shocks

In a previous post, we described the rapid growth of the stablecoin market over the past few years and then discussed the TerraUSD stablecoin run of May 2022. The TerraUSD run, however, is not the only episode of instability experienced by a stablecoin. Other noteworthy incidents include the June 2021 run on IRON and, more recently, the de-pegging of USD Coin’s secondary market price from $1.00 to $0.88 upon the failure of Silicon Valley Bank in March 2023. In this post, based on our recent staff report, we consider the following questions: Do stablecoin investors react to broad-based shocks in the crypto asset industry? Do the investors run from the entire stablecoin industry, or do they engage in a flight to safer stablecoins? We conclude with some high-level discussion points on potential regulations of stablecoins.
Banking System Vulnerability: 2023 Update

The bank failures that occurred in March 2023 highlighted how unrealized losses on securities can make banks vulnerable to a sudden loss of funding. This risk, which materialized following the rapid rise in interest rates that began in early 2022, underscores the importance of monitoring the vulnerabilities of the banking system. In this post, as in previous years, we provide an update of four analytical models aimed at capturing different aspects of vulnerability of the U.S. banking system, with data through the second quarter of 2023. In addition, we discuss changes made to the methodology based on the lessons from March 2023 and assess how the system-level vulnerability has evolved.


 RSS Feed
 Follow Liberty Street Economics