


2 posts on "extreme weather"
November 10, 2023
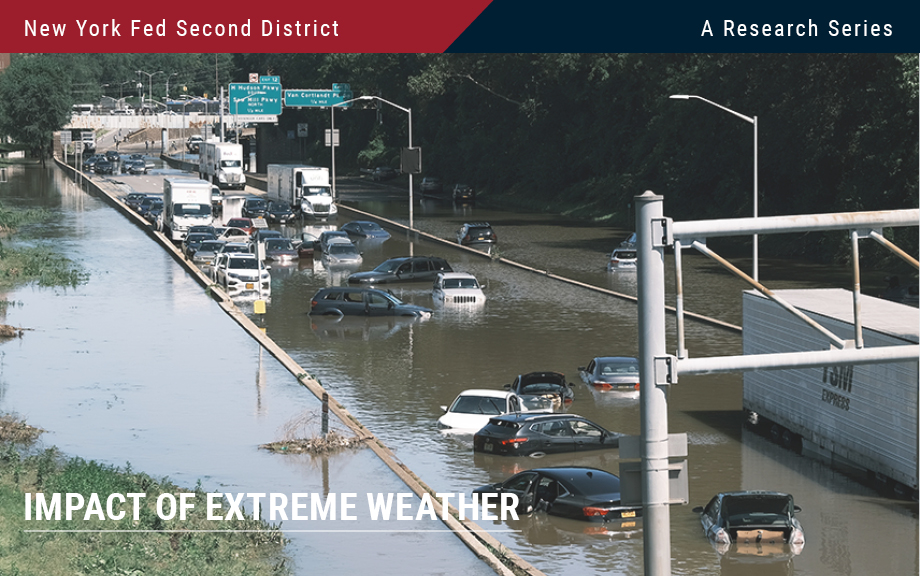
Potential Flood Map Inaccuracies in the Fed’s Second District
The National Flood Insurance Program (NFIP) flood maps, which designate areas at risk of flooding, are updated periodically through the Federal Emergency Management Agency (FEMA) and community efforts. Even so, many maps are several years old. As the previous two posts in the Extreme Weather series show, climate-related risks vary geographically. It is therefore important to produce accurate maps of such risks, like flooding. In this post we use detailed data on the flood risk faced by individual dwellings as well as digitized FEMA flood maps to tease out the degree to which flood maps in the Second District are inaccurate. Since inaccurate maps may leave households or banks exposed to the risk of uninsured flood damage, understanding map inaccuracies is key. We show that, when aggregated to the census tract level, a large number of maps do not fully capture flood risk. However, we are also able to show that updates do in fact improve map quality.
November 8, 2023
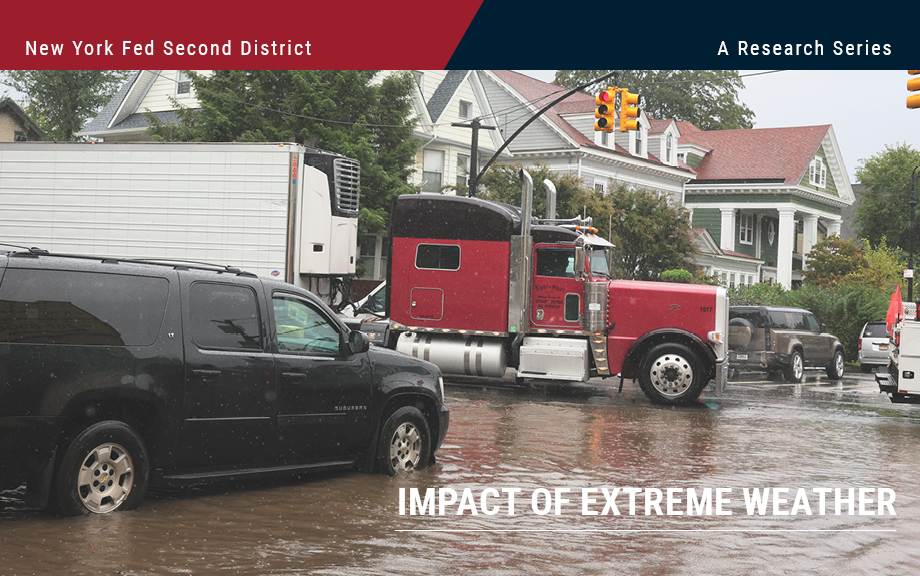
Blog Series on the Economic and Financial Impacts of Extreme Weather Events in the Fed’s Second District
The frequency and ferocity of extreme weather events, such as flooding, storms, and deadly heat waves, have been on the rise in recent years. These climate events, along with human adaption to cope with them, may have large effects on the economy and financial markets. It is therefore paramount to provide research about the economy’s vulnerability to climate events for policymakers, households, financial institutions, and other players in the world economy to make informed decisions. In the coming days, we are going to present a series of nine posts that attempt to take a step in this direction while focusing on the Federal Reserve System’s Second District (NY, northern NJ, southwest CT, Puerto Rico, and the U.S. Virgin Islands). The twelve Federal Reserve Districts are depicted in this map.
 RSS Feed
 Follow Liberty Street Economics