


The National Flood Insurance Program (NFIP) flood maps, which designate areas at risk of flooding, are updated periodically through the Federal Emergency Management Agency (FEMA) and community efforts. Even so, many maps are several years old. As the previous two posts in the Extreme Weather series show, climate-related risks vary geographically. It is therefore important to produce accurate maps of such risks, like flooding. In this post we use detailed data on the flood risk faced by individual dwellings as well as digitized FEMA flood maps to tease out the degree to which flood maps in the Second District are inaccurate. Since inaccurate maps may leave households or banks exposed to the risk of uninsured flood damage, understanding map inaccuracies is key. We show that, when aggregated to the census tract level, a large number of maps do not fully capture flood risk. However, we are also able to show that updates do in fact improve map quality.
Flood Map Updates
The NFIP was established in the late 1960s following severe riverine flooding in the U.S. heartland. As part of the flood insurance program, FEMA works with communities to create maps of areas in the United States that face heightened flood risk. One of the most important implications of these flood maps is the insurance requirement for mortgage borrowers. Mortgage applicants in regions that have at least a 1 percent chance of flooding each year must purchase flood insurance. The program as well as the implications for the mortgage market are discussed in previous Liberty Street Economics posts (see here and here).
The chance of a region flooding is not static, however. On the one hand, the climate continues to change, and the risks posed by a rising sea level, hurricanes, or even summer rains are constantly evolving. On the other hand, many communities proactively manage flood risks through the construction of dams, floodways, or elevated dwellings to reduce the chance of catastrophic damage. Consequently, FEMA periodically updates flood maps. These updates can see some previously “unmapped” regions receive a flood risk designation while other regions may lose this categorization following local improvements. Our data indicates that, although the number of parcels designated as exposed to “flood risk” grows on average, more than a third of all changes involve some parcels of land receiving a lower risk designation. However, the complicated nature of modeling risks—coupled with the necessity of community input—means that maps may be updated infrequently and thus become outdated quickly. Despite recent efforts to update maps, many are still decades old.
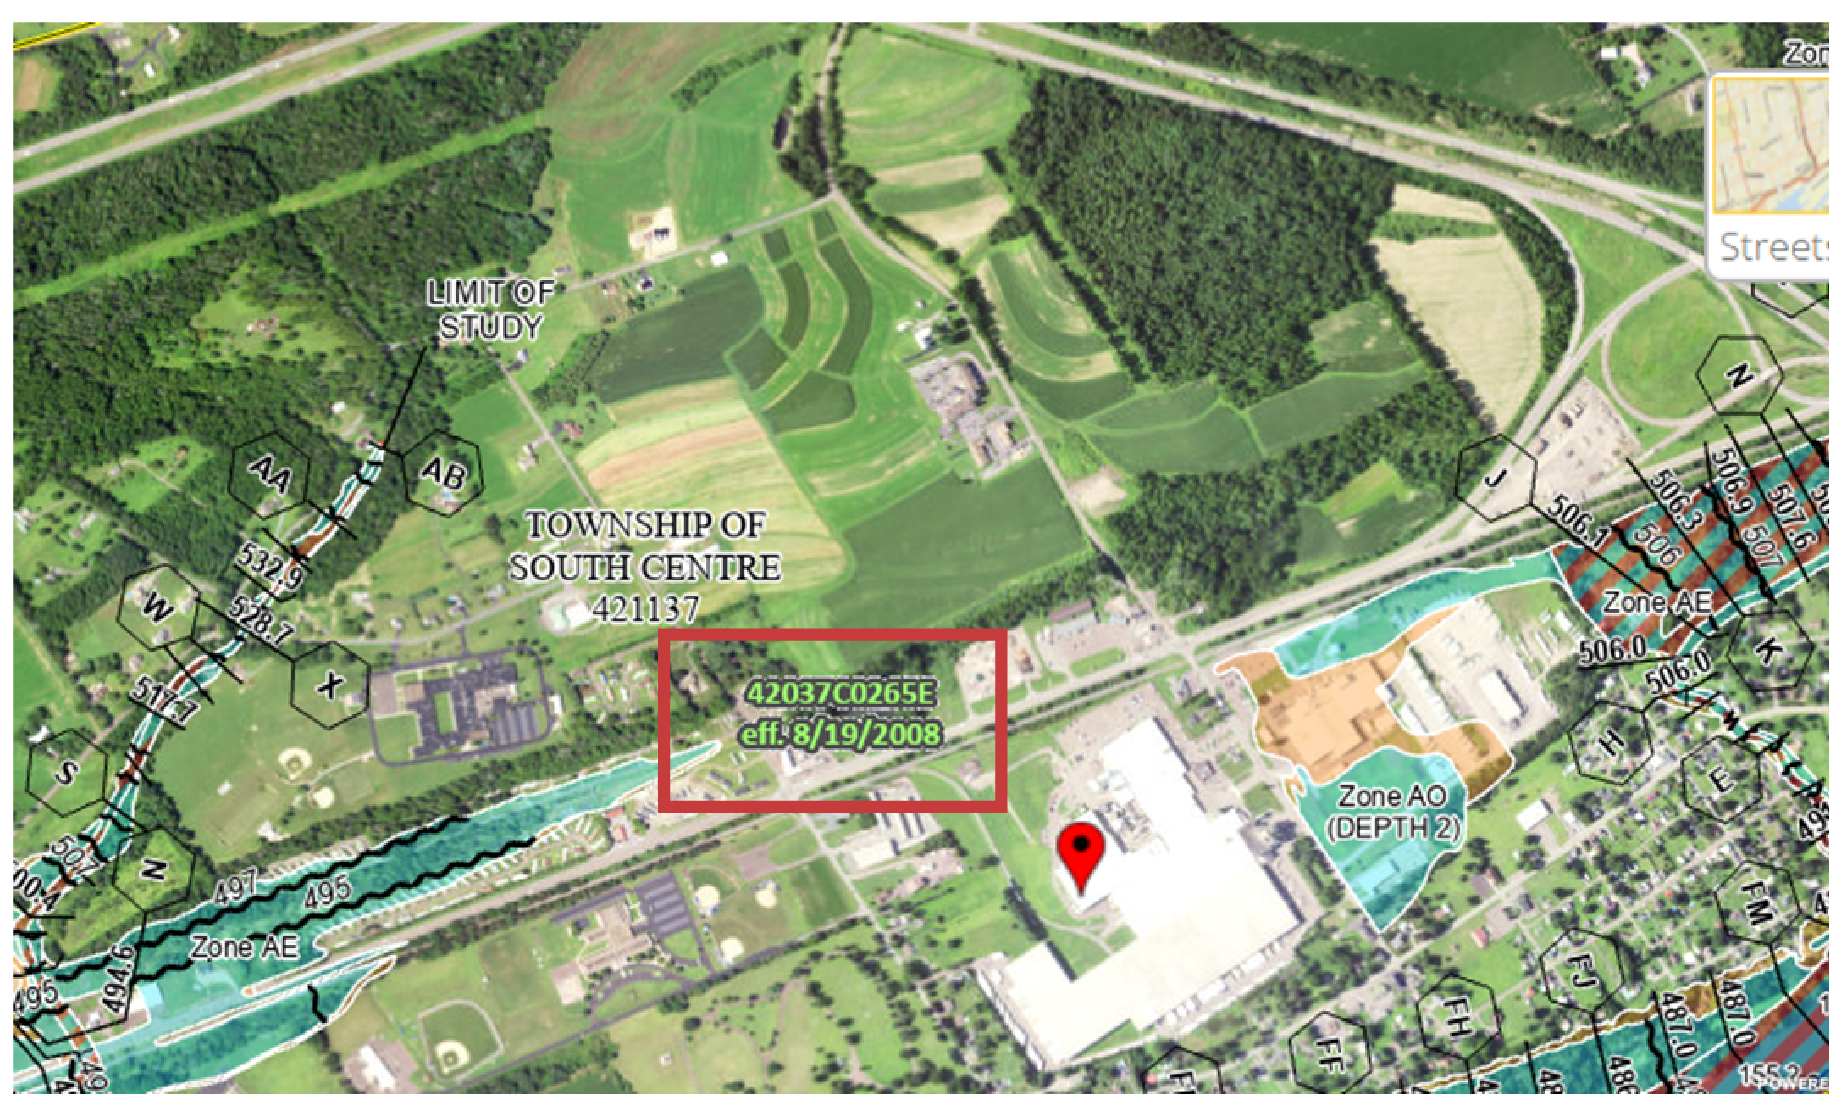
Notes: This map depicts a FEMA South Centre, PA flood map as taken from FEMA’s mapping center as of June 2023.. As can be seen from the red highlight, the map has been in place since 2008, with no amendments having occurred since then in the area depicted.
Outdated maps may result in risks that borrowers or lenders are unaware of—see the above map that depicts a map that is fifteen years old. A quarter of all maps were fifteen years old in 2022 and over half were more than five years old. It is possible that the flood zones depicted in the map have changed since the map was last updated. As a consequence, some homeowners, who might have bought insurance had they been aware of the risks, will be ill prepared and under-insured in the event a disaster strikes. Although understanding the degree to which properties face unknown risks has been complicated by the paucity of data, we attempt to address this issue by capitalizing on new data that has recently become available.
Flood Map Accuracy
FEMA’s process for updating maps involves community input as well as possible amendments to the maps by individual property owners willing to contest maps using their own surveyors. Moreover, its maps designate stark flooding boundaries—a location is either in or outside of a flood zone. Third-party providers are able to use flood models and elevation mapping, as well as satellite imaging to assign more granular risk measures to an area without the need for community input.
We use data for 2021 on the flood risk faced by individual properties in the United States, as provided by CoreLogic, to ascertain the degree to which some properties may be inaccurately flood-mapped. Recently, CoreLogic began estimating average annual flood damage for properties across the United States. We plot a property on the most recent iteration of flood maps, which enables us to see whether the property has been assigned a 100-year, 500-year, or no flood risk status. Subsequently, we compare the official risk designation with expectations from CoreLogic on the likelihood that a property would face more than $1,000 in damages in the event of flooding (see a description of CoreLogic’s methodology). We run this exercise for about fifteen million individual properties in the Second District. We then aggregate the data to the census tract-level. A census tract with a higher share of properties that would have received a flood zone designation using the CoreLogic methodology, but do not have one under the FEMA map, is colored a darker shade of blue in the map below.
Second District Census Tract with Potentially Inaccurate Flood Maps
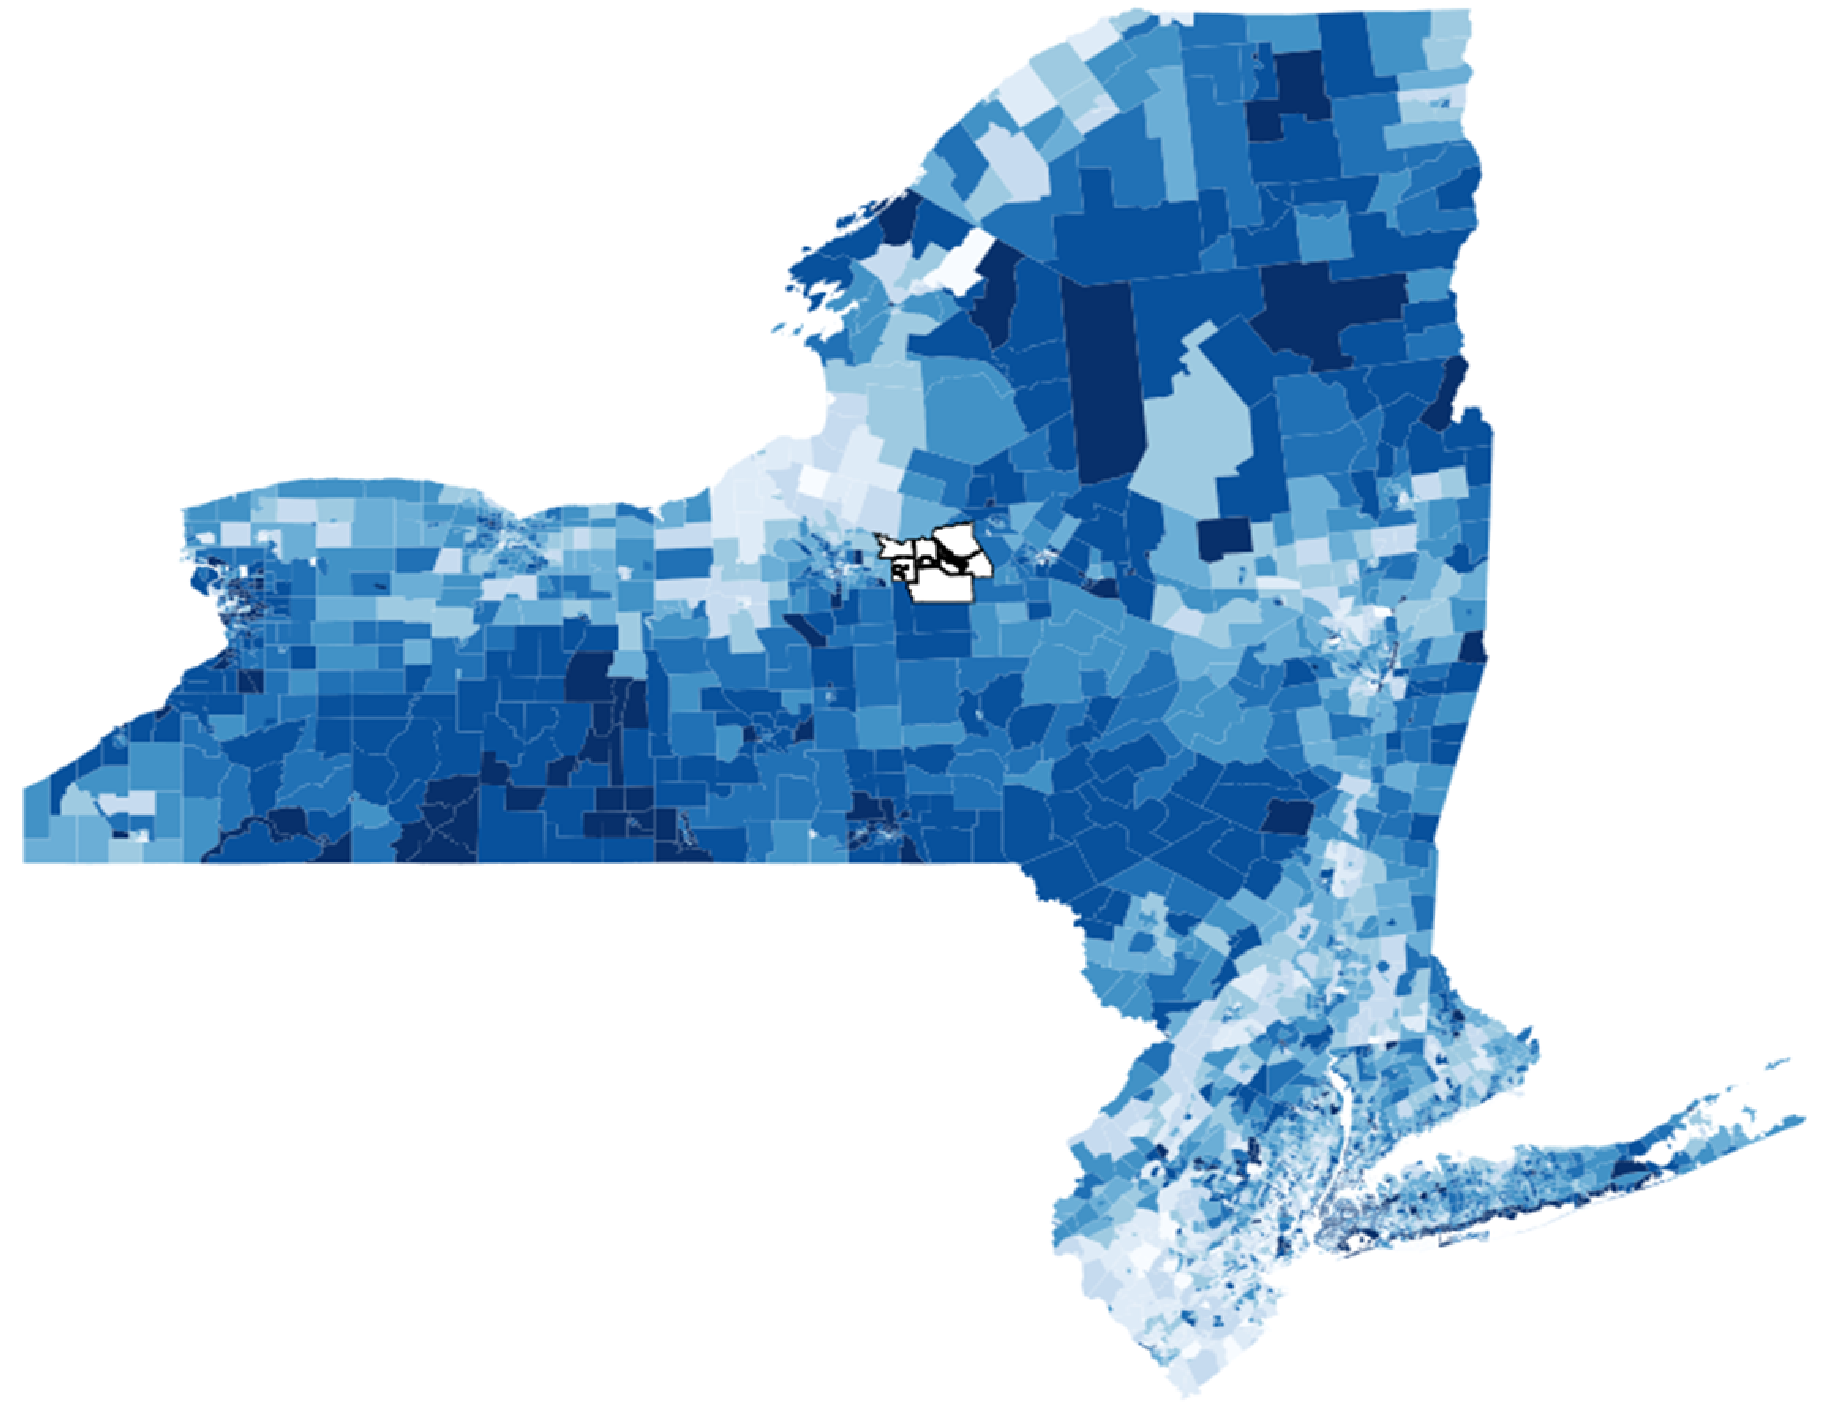
Note: This map depicts the Second District excluding Puerto Rico and the U.S. Virgin Islands. We show census tracts and color these by the degree to which they may be inaccurately flood-mapped. An inaccurately mapped property is one that faces significant flood risk, but is not designated as being in a flood zone. We then aggregate to the census tract level, with darker shaded regions home to a greater share of inaccurate properties. The maximum reflected on the map is 60 percent inaccurate, with lighter shaded areas showing barely any inaccuracies.
Flood Map Updates
It is reassuring to see that the most accurately mapped areas are where maps have been updated most recently. In the next map, we again plot the Second District, and highlight those census tracts with significant (positive) map changes. These are regions where the flood zone designation has been expanded, based on map changes between 2013 and 2022 in our historical map data.
Second District, excluding Connecticut, Puerto Rico, and U.S. Virgin Islands
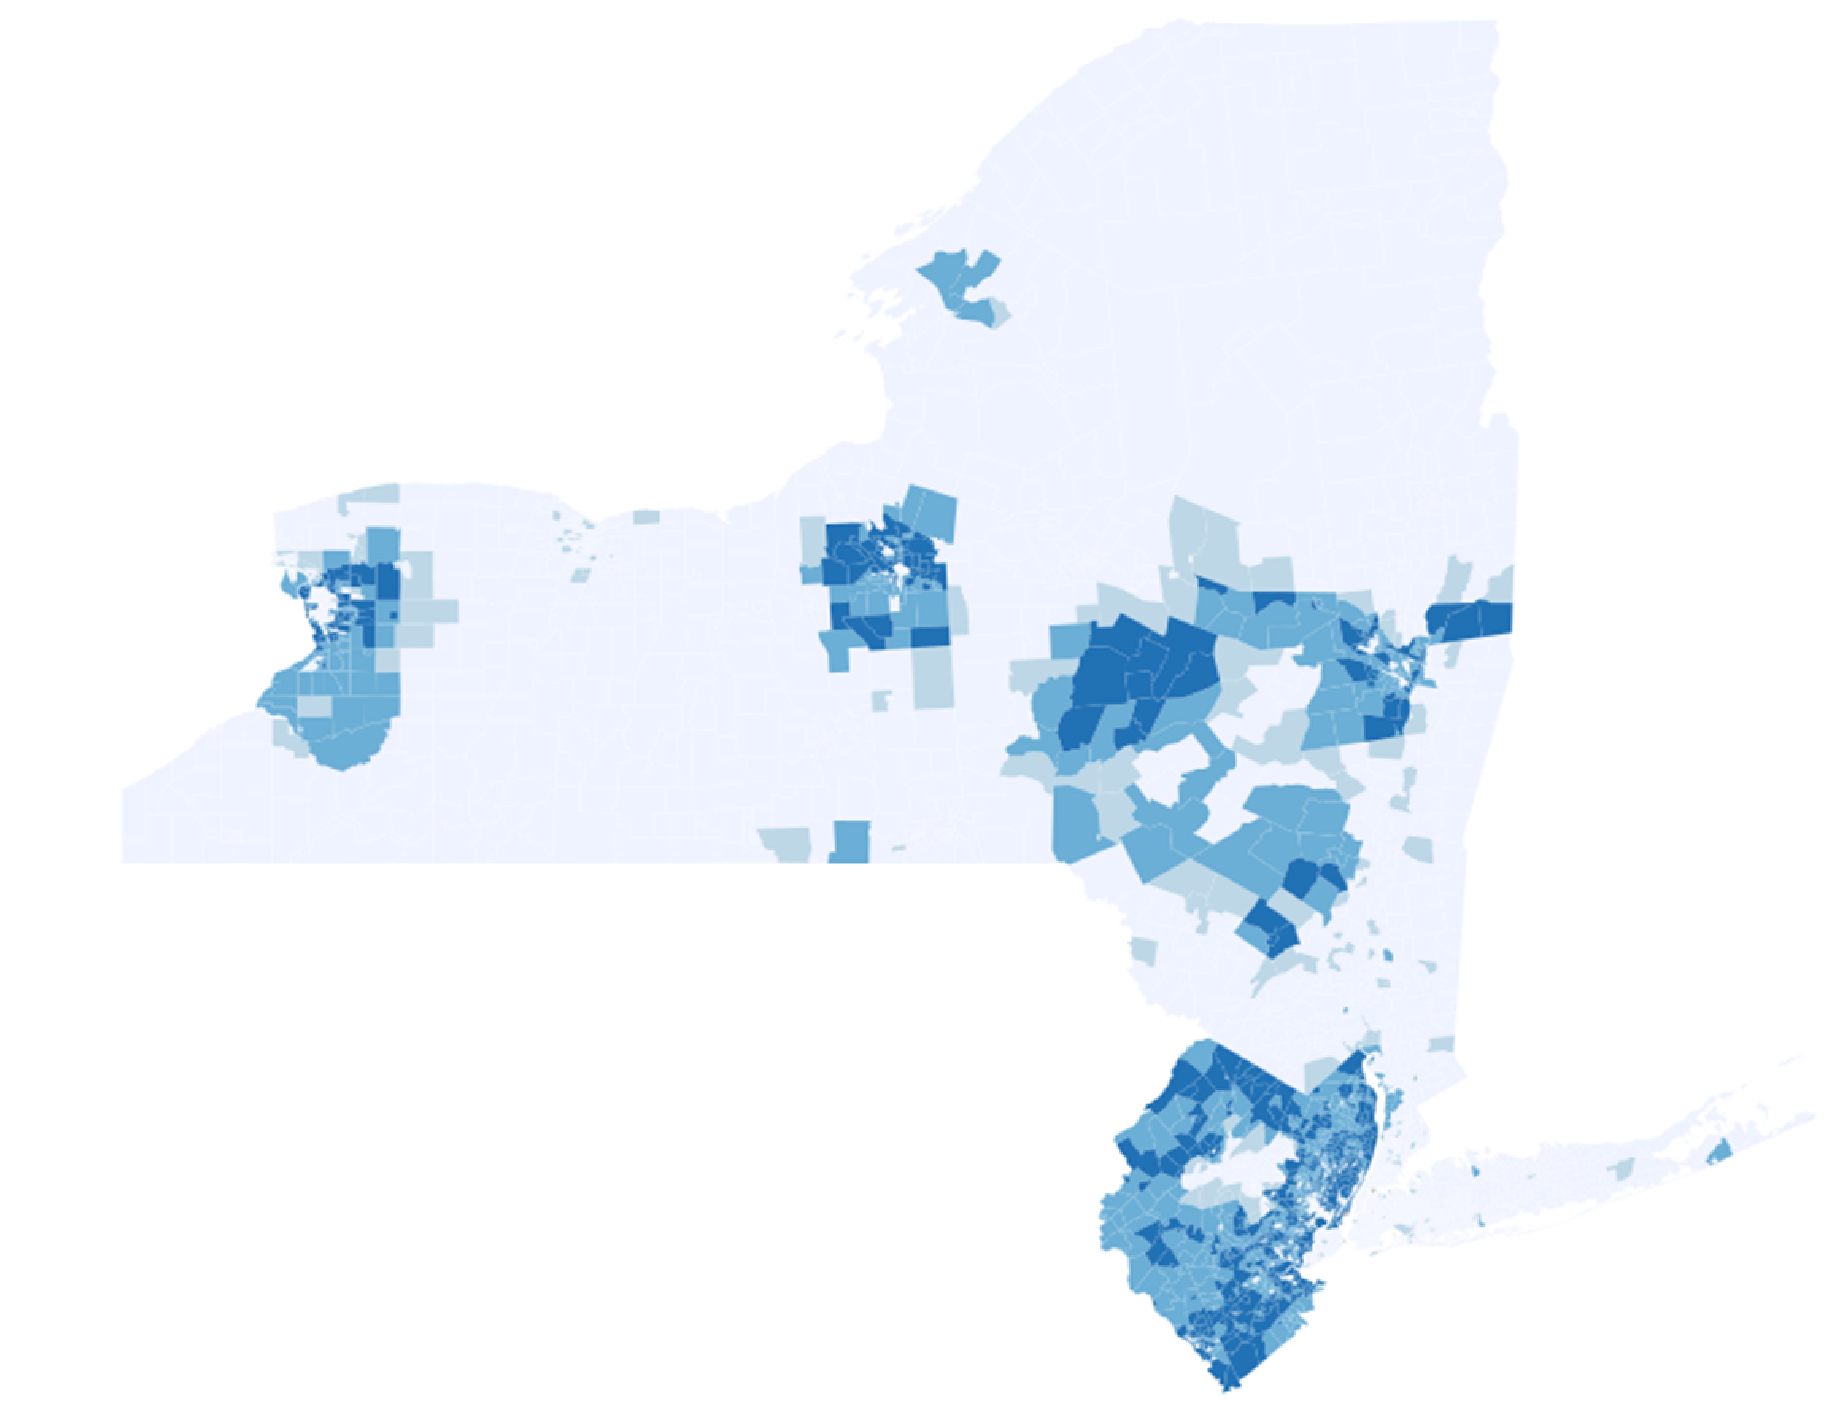
Notes: This map shows positive map updates. Blue shaded regions are those that saw substantial growth of mapped regions between 2013 and 2022. The darkest shading indicates areas that were not flood-map covered in 2013 but are completely covered in 2022. Missing data means we exclude CT in this representation.
The most shaded areas in the above map are those regions that have undergone significant map changes—with regions in dark blue becoming fully mapped, where no map existed before. The more darkly shaded areas in the above map are those that are less shaded in the second map above, implying a negative correlation between map updates and map inaccuracies. The correlation coefficient is larger than -0.5 and significant, implying map updates reduce inaccuracies. This suggests that FEMA’s updating efforts are valuable in improving map quality, despite the associated costs to FEMA and communities. The result holds true in the nation as a whole and not just in the Second District. Thus, recent map updates have reduced map inaccuracies.
Concluding Remarks
FEMA maps are often inaccurate due to the delay in updating maps to reflect changes in the flood risks. This follows naturally from the fact that updating takes a long time and requires costly surveys, community input, and damage assessments. Outdated maps are likely imperfect reflections of risk. Several areas in the Second District may be inaccurately mapped with consequences for the under-insurance of households. However, map updates–when they occur–reduce the inaccuracies, meaning FEMA’s updating efforts are both necessary and valuable. The next post in the Extreme Weather series examines how these inaccuracies may impact bank lending in the Second District.

Kristian Blickle is a financial research economist in Climate Risk Studies in the Federal Reserve Bank of New York’s Research and Statistics Group.
Katherine Engelman is a former data scientist in the Data and Analytics Office in the Bank’s Technology Group.

Theo Linnemann is a data scientist in the Data and Analytics Office in the Bank’s Technology Group.

João A.C. Santos is the director of Financial Intermediation Policy Research in the Federal Reserve Bank of New York’s Research and Statistics Group.
How to cite this post:
Kristian Blickle, Katherine Engelman, Theo Linnemann, and João A.C. Santos, “Potential Flood Map Inaccuracies in the Fed’s Second District,” Federal Reserve Bank of New York Liberty Street Economics, November 10, 2023, https://libertystreeteconomics.newyorkfed.org/2023/11/potential-flood-map-inaccuracies-in-the-feds-second-district/
BibTeX: View |
Disclaimer
The views expressed in this post are those of the author(s) and do not necessarily reflect the position of the Federal Reserve Bank of New York or the Federal Reserve System. Any errors or omissions are the responsibility of the author(s).
 RSS Feed
 Follow Liberty Street Economics