


Climate change may pose two types of risk to the economy—from policies and consumer preferences as the energy system transitions to a lower dependence on carbon (in other words, transition risks) or from damages stemming from the direct impacts of climate change (physical risks). In this post, we follow up on our previous post that studied the exposure of the Federal Reserve’s Second District to physical risks by considering how transition risks affect different parts of the District and how they differentially affect the District relative to the nation. We find that, relative to other regions of the U.S., the economy of the Second District has considerably less exposure to fossil fuels. However, the cost of reducing even this relatively low economic dependence on carbon is still likely to be considerable.
How Exposed Is the Second District to Fossil Fuels?
Broadly speaking, “transition risks” are those costs and impacts associated with moving an economy away from a reliance on fossil fuels and making it resilient to the effects of climate change. Unlike physical risks, transition risks are a result of political or consumer actions that drive the economy. Transition risk can entail higher energy prices from retrofitting power grids, construction of new types of buildings, or even updates to transportation infrastructure to deal with a changing climate, as well as more direct costs associated with direct or indirect emissions pricing. Understanding the degree to which the Second District is affected by possible transition risks—especially when compared to other parts of the nation—is key to understanding the path ahead. For this analysis, we rely on measures of carbon intensity as a proxy for the degree of change that may be necessary.
In the map below, we consider data from the Energy Information Administration (EIA) on the carbon intensity of the economy in each U.S. state. This measure represents the number of metric tons of CO2 emitted in a given state per million dollars of GDP produced in that state. We see that New York State requires less than 250 metric tons of CO2 to produce a million dollars of GDP—a ratio that compares favorably to states with populations larger than New York, specifically to California, Florida, and especially Texas, which requires around 500 metric tons of CO2 to produce a million dollars of GDP. States such as West Virginia, Louisiana, and Wyoming that are much more reliant on energy production require emitting up to 1,000 tons of CO2 to produce a million dollars’ worth of output. The only area of the U.S. with an appreciably lower carbon intensity than New York State is Washington, D.C., likely because it is a metropolitan area with little mineral extraction. Looking at other parts of the Second District doesn’t change our conclusions, as Connecticut has essentially the same carbon intensity as New York, while New Jersey has only a slightly higher intensity. (We exclude U.S. territories from our calculations for both the Second District and the U.S. given the lack of available data for this exercise.) Therefore, the Second District has a much smaller carbon footprint relative to the size of its economy than the U.S. as a whole.
The Second District Trails the Country in Carbon Intensity
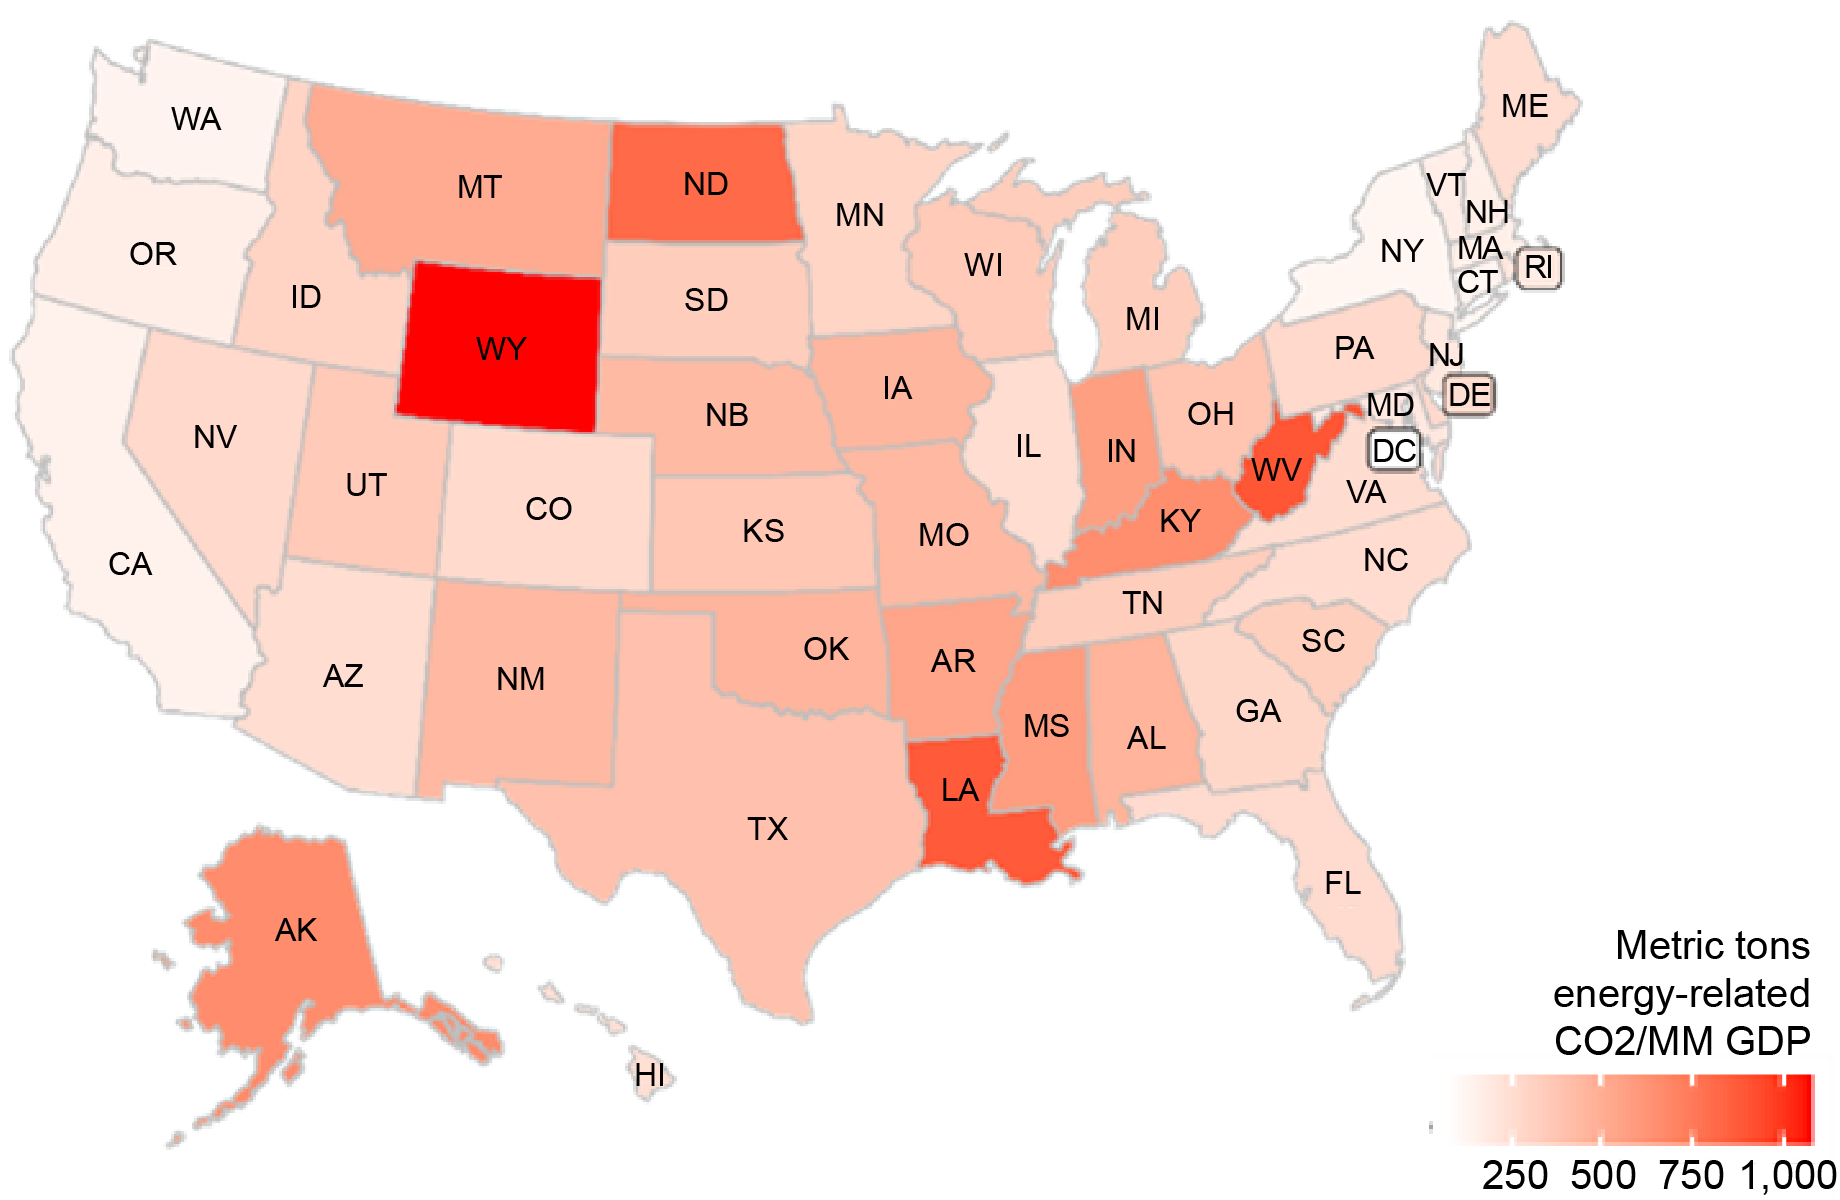
Source: U.S. Energy Information Administration (EIA).
Note: The map depicts the amount of CO2 required to produce $1 million of GDP, by state.
While New York State imports some of its electrical energy, much of its locally generated power and the power it imports from Canada is produced with renewable resources. According to a recent report by the New York State Research and Development Authority (NYSERDA), the predominant method of power generation in the state is hydroelectric, with nuclear making up almost the entire remaining energy production. This implies that New York State’s power generation may need fewer investments than that of other states to facilitate the transition. As can be taken from the map below, parts of the Midwest and the Great Plains states are much more heavily dependent on CO2-emitting power generation.
Second District Power Is Not Very Carbon Dependent
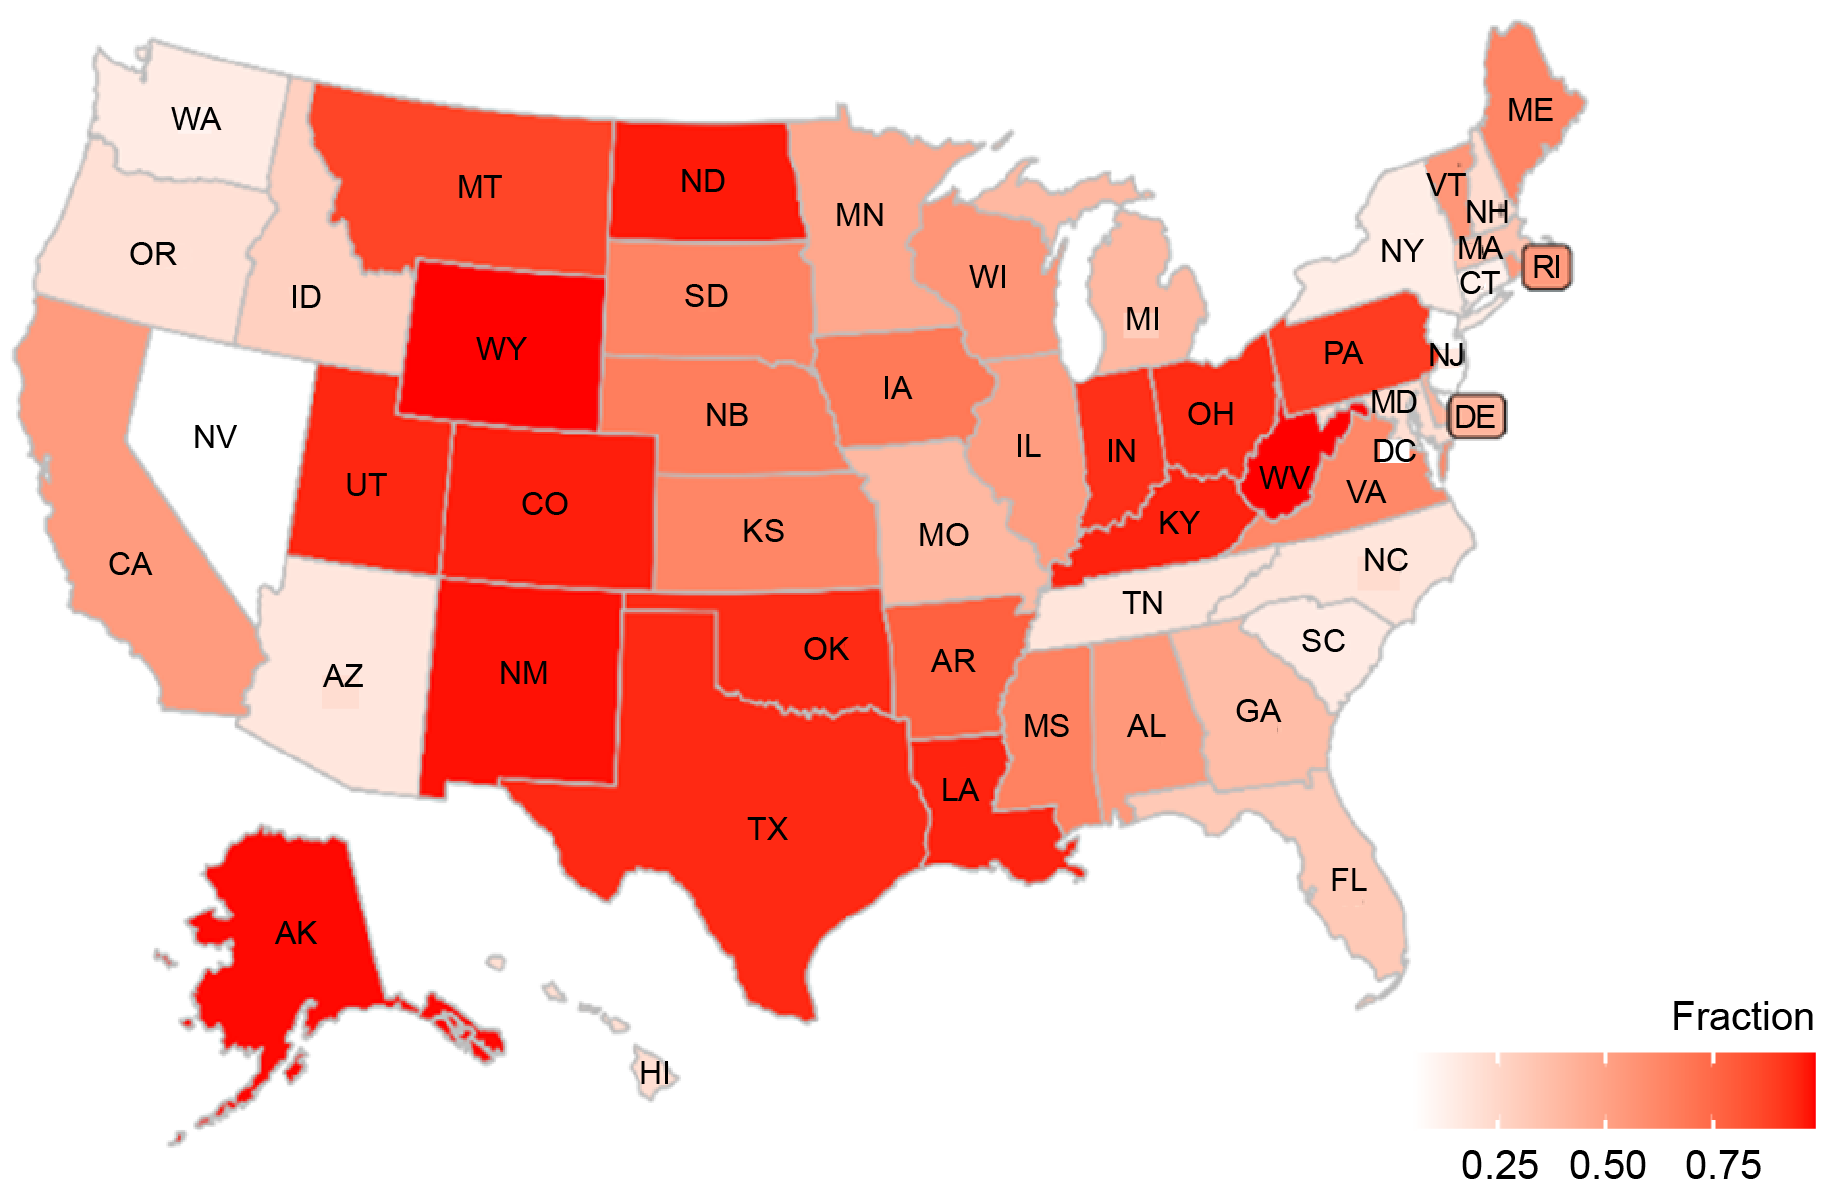
Source: Calculations by Board of Governors and Federal Reserve Bank of New York staff.
Note: The map shows the carbon intensity of the power generation of U.S. states on a scale from 0 to 1.
We can also look at the distribution of transition risks within the Second District. While data on CO2 emissions by county are not produced, we can use another metric: the fraction of the workforce in each county who are employed in the energy-intensive sectors of mining, quarrying, extraction, and utilities, obtained from the Quarterly Census of Employment and Wages (QCEW). Within the U.S., the states comprising the Second District have some of the lowest fractions of workers employed in these sectors. The map below shows that this fraction is essentially zero in New York City, most of the Hudson Valley, large parts of central New York and New Jersey, and in Fairfield County, Connecticut. Some counties in northern New York State and along the state’s border with Pennsylvania have some employment in these sectors, but it is generally less than 1.5 percent of these counties’ workforce. Only four counties in the Second District have a greater fraction of their workforce in the energy-intensive occupations, the most reliant county having 5.3 percent of its workforce in that sector.
Small Share of Second District Workforce Is Employed in Carbon-Intense Industries
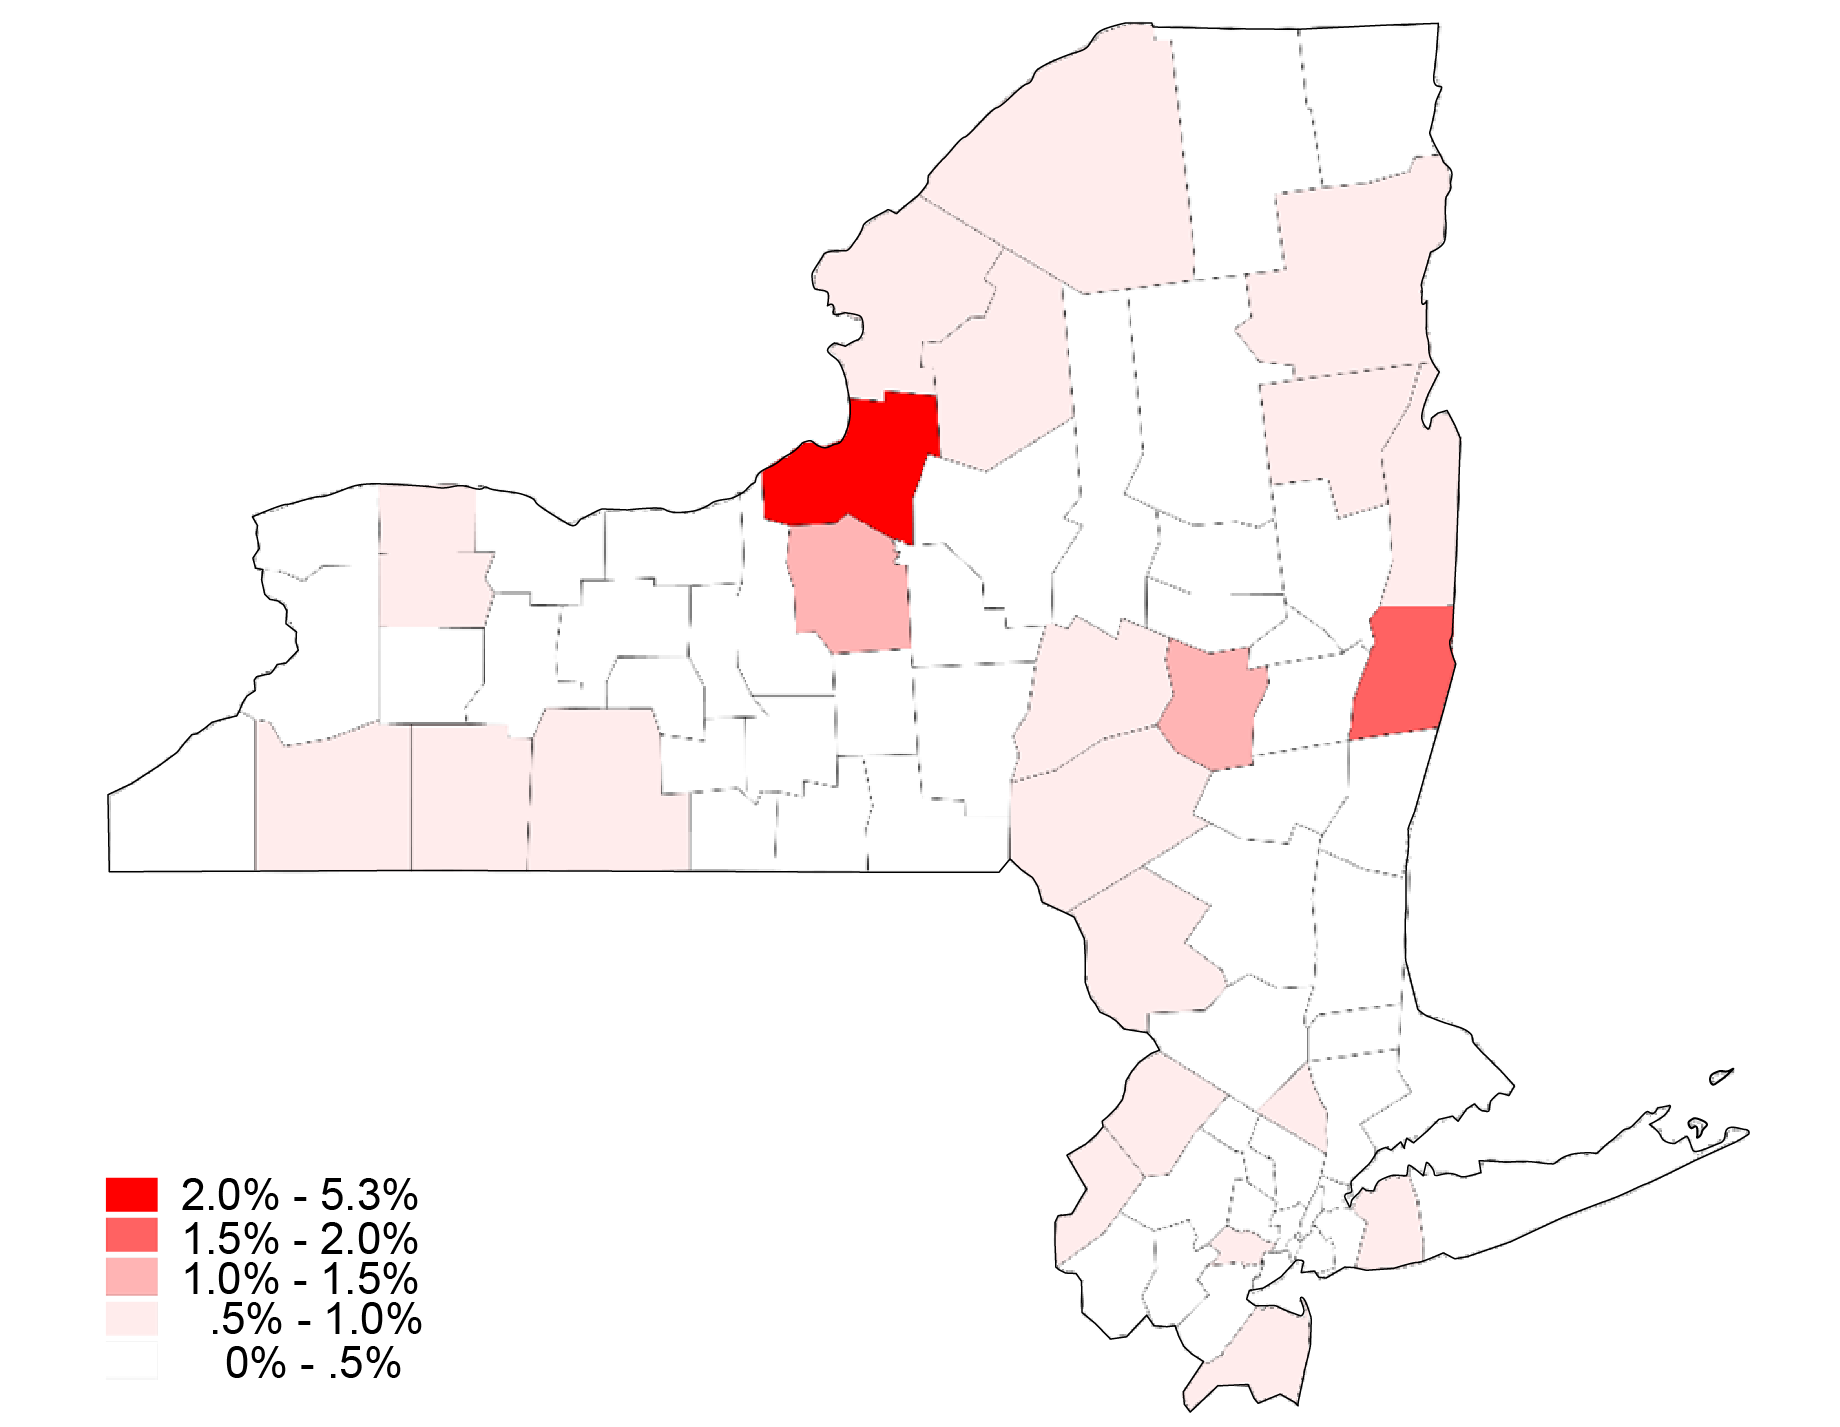
Source: Quarterly Census of Employment and Wages (QCEW).
Note: The map shows the share of each county’s workforce employed in sectors such as mining, quarrying, extraction, and utilities.
While the Second District is less reliant on carbon than the nation as a whole, decreasing carbon’s role in the District’s economy may be expensive. A substantial component of this effort will involve retrofitting buildings to be more energy efficient and to release less greenhouse gases, a task that may be particularly complicated in dense urban areas such as New York City. According to a recent New York Fed white paper, building upgrades will cost New York State one-third of a percent of GDP per year over thirty years; while small, this figure still represents a large fraction of the state budget, and much of these funds will likely be provided by the state government. Based on the carbon intensity of the Second District’s energy production and the degree to which the District relies on carbon to generate GDP, the direct costs associated with transition are likely to be lower for the District than for other regions of the country. However, given the complexity of climate-proofing dense urban areas such as New York City, the District’s specific transition plans may entail costs that exceed estimates based solely on its carbon intensity.
Concluding Remarks
The Second District’s exposure to carbon-intense GDP generation—and therefore its likely exposure to transition risk—is relatively low. This holds especially when compared to that of energy-intense states in the Midwest. However, making older and dense urban areas climate-proof could still entail significant costs that the states of the Second District may have to bear. Both this post and our earlier post on physical risk point to the regional heterogeneity in risk exposure across the United States. Measuring such risks accurately, however, may be difficult, particularly if a more granular geographical focus is employed. The next post in this series highlights this issue by looking at inaccuracies in flood risk maps in the Second District.

Kristian Blickle is a financial research economist in Climate Risk Studies in the Federal Reserve Bank of New York’s Research and Statistics Group.

Rajashri Chakrabarti is the head of Equitable Growth Studies in the Federal Reserve Bank of New York’s Research and Statistics Group.

Maxim Pinkovskiy is an economic research advisor in Equitable Growth Studies in the Federal Reserve Bank of New York’s Research and Statistics Group.
How to cite this post:
Kristian Blickle, Rajashri Chakrabarti, and Maxim Pinkovskiy, “Transition Risks in the Fed’s Second District and the Nation,” Federal Reserve Bank of New York Liberty Street Economics, November 9, 2023, https://libertystreeteconomics.newyorkfed.org/2023/11/transition-risks-in-the-feds-second-district-and-the-nation/
BibTeX: View |

Disclaimer
The views expressed in this post are those of the author(s) and do not necessarily reflect the position of the Federal Reserve Bank of New York or the Federal Reserve System. Any errors or omissions are the responsibility of the author(s).
 RSS Feed
 Follow Liberty Street Economics
Very interesting and thoughtful overview. Other steps will entail tracking distribution and timing of costs offset by federal (state and local) credits, incentives, and reimbursements through GGRA Greenhouse Gas reduction Act) spread out from early and over 30 year life-cycle/ recovery period. Particularly important to stratify impacts/costs on low income and disadvantaged populations such as concentrate in Community Development zip-codes.