Jaison R. Abel and Richard Deitz
What explains why some places suffered particularly severe job losses during the Great Recession? In this post, we extend our recent Current Issues article analyzing regional dimensions of the latest housing cycle and show that metropolitan areas that experienced the biggest housing booms and busts from 2000 to 2008 lost the most jobs during the recession. Not surprisingly, construction activity helps explain the tight link between housing and local job market performance. Given this pattern, we believe that each metro area’s boom-bust experience is likely to continue to influence its growth prospects for some time to come.
To explore this topic, we first examine the geography of the boom and bust in housing by looking at regional home price changes. On average, home prices more than doubled in the United States between 2000 and 2006, but declined sharply between 2006 and 2008 before beginning to stabilize in 2009. However, underlying this average is dramatic variation in the extent of the boom and bust in metro areas across the country.
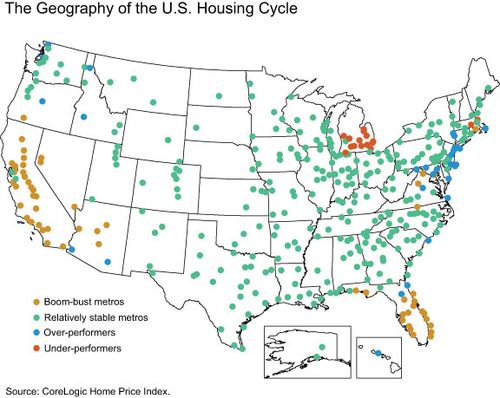
To illustrate this geographic diversity, we show the experience of U.S. metropolitan areas on the map below. We assign each metro area to one of four categories according to where its rate of home price appreciation fell relative to the nation’s during the boom years of 2000-06 and the bust years of 2006-08.
-
- Boom-bust metros’ home prices increased faster than the U.S. average during the boom years (11 percent), and then fell at a more rapid pace than the national average during the bust years (-9 percent).
-
- Relatively stable metros’ home prices increased more slowly than the nation’s during the boom years, but fared better than the nation’s during the bust years.
-
- Over-performers’ home prices increased more rapidly than the nation’s during the boom and declined less rapidly than the nation’s during the bust.
- Under-performers’ home prices increased more slowly than the national rate during the boom, and declined more rapidly than the national rate during the bust.
The geographic concentration of these different groups is apparent in the map. Boom-bust metros cluster in the “sand states” of Arizona, California, Florida, and Nevada; indeed, many of these places have become symbols of the housing boom-and-bust cycle. Metros in the relatively stable group populate much of the country, while over-performers tend to cluster along the coasts. Nearly all the metropolitan areas classified as under-performers are located in Michigan, where local economic activity was weak even during the expansion, primarily because of a significant decline in auto manufacturing.
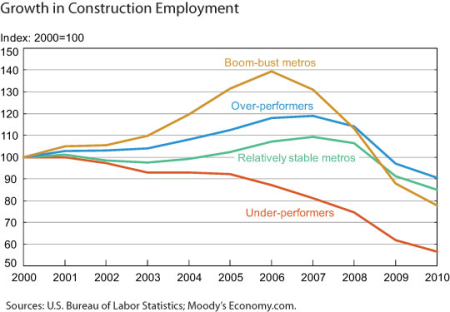
How do these experiences in housing relate to local business cycles? It turns out that the severity of the local housing cycle is closely tied to local job growth during the expansion and recession. Probably the most direct effect of housing on local economies is evident in construction employment, which includes home building, remodeling, and related jobs. The chart below shows the growth in construction jobs for each of the four metro groups. Not surprisingly, the boom-bust areas experienced the most rapid construction employment growth during the housing boom, with jobs expanding nearly 40 percent through 2006, more than double the rate of increase for the over-performers. The relatively stable metros saw construction jobs grow by just 7 percent. By contrast, construction activity actually declined during the housing boom in the under-performing areas, indicating that weak economic conditions in these areas prevailed long before the housing downturn.
The boom-bust metros began to see declines in construction employment as early as 2006. From peak employment in 2006 through October 2010, construction jobs in these areas fell a whopping 44 percent, more than reversing their gains during the housing boom. By contrast, the over-performers and relatively stable areas did not have as far to fall—construction job losses began later and were far less severe. Meanwhile, with the onset of the Great Recession, the decline in construction employment already under way in the under-performing metros accelerated, cutting the number of construction jobs nearly in half between 2000 and 2010.
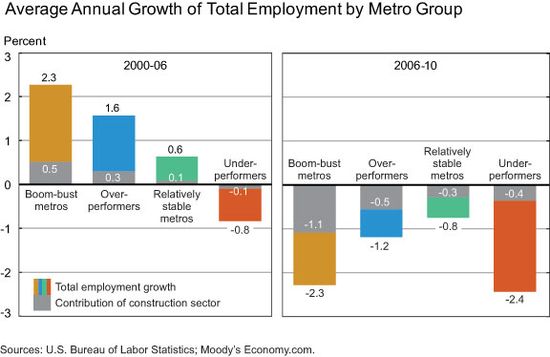
To what extent did a metro’s swings in construction jobs contribute to the fluctuations in overall local job growth during the boom and through the recession? The two panels of the chart below show a remarkably strong connection between the average annual change in total employment for each group of metros during the housing boom (left panel) and since then (right panel), and make it clear that jobs in the construction sector helped shape these patterns.
During the boom, the metro areas with the most rapid increases in home prices also grew the fastest, and their construction sectors were an important part of that growth. The annual rate of job growth in the boom-bust areas (2.3 percent) was roughly 50 percent faster than in the over-performing metros (1.6 percent), and these two groups fared far better than the relatively stable group; the under-performers struggled with job losses during the housing boom.
Turning to the bust period and beyond (right panel), we see a similar influence from the housing market. While no area escaped the effects of the Great Recession entirely, local job growth during the downturn was also closely tied to the housing cycle. In particular, areas where home prices increased the most—the boom-bust and over-performing metros—experienced the sharpest job losses during the downturn, and declines in construction activity proved to be a significant drag on these local economies. In the boom-bust metros, jobs declined at an average annual rate of 2.3 percent during this period, with the construction sector accounting for almost half of this decline. By contrast, even with the onset of the Great Recession, the relatively stable metros experienced an average annual job decline of less than 1 percent, about a third of which was attributable to the construction sector.
As housing markets across the country continue to stabilize, the direct impact of housing on local economic activity is likely to diminish. However, because the adjustment process in the hardest-hit areas does not appear to be complete, the recovery there may well be sluggish for some time. Moreover, because deep home price declines in many areas have eroded the value of an important household asset, negative wealth effects may continue to cause consumers to reduce their spending more generally. This newfound frugality will likely exert an ongoing drag on local economic activity during the recovery. (For analysis of this recent change in consumer behavior, see “Have Consumers Been Deleveraging?,” “Just Released: Household Debt and Credit Developments in the Nation and the Region in 2011:Q1” and updates in the New York Fed’s Credit Conditions website.) Clearly, restoring the health of the housing market is essential to helping local economies recuperate from the effects of the Great Recession.
Disclaimer
The views expressed in this blog are those of the author(s) and do not necessarily reflect the position of the Federal Reserve Bank of New York or the Federal Reserve System. Any errors or omissions are the responsibility of the author(s).


 RSS Feed
 Follow Liberty Street Economics