Rajashri Chakrabarti and Elizabeth Setren*
Surprisingly, there is no literature on how recessions (including the Great Recession) have affected schools. Perhaps this is because educational funding stresses and decisions vary among and within states, which makes it hard to reach general conclusions. Yet schools play an indispensable role in our society, educating the populace and building the nation’s future. Therefore, it is important to understand how the Great Recession is affecting public spending on schools, the delivery of education services, and student learning. In this post, we analyze one state’s experience, drawing on our study “The Impact of the Great Recession on School District Finances: Evidence from New York.” While we do not find evidence of much impact on schools’ overall revenue or expenditures, we do detect important compositional changes that could affect both student learning and school financing in coming years.
Across the nation, state and local governments saw declining revenue from income, property, and sales taxes after the onset of the recession and the bursting of the housing bubble in 2007. According to the CoreLogic Home Price Index, New York saw a 13.5 percent drop in housing values from October 2006, before the housing market crash, to February 2009, right before the market started to recover. Local governments often receive a large portion of their funding from property taxes, so this decline restricted their ability to maintain school funding levels. New York’s unemployment rate almost doubled during the crisis, causing state tax revenues to fall 8 percent from 2007 to 2009. The financial downturn limited state and local governments’ ability to fund school districts fully and resulted in difficult budgetary decisions.
In the fall of 2009, the federal government allocated $100 billion to states for education through the American Recovery and Reinvestment Act (ARRA) to stave off serious budget cuts and lessen the impact of declining state and local funding. Districts were directed to use the ARRA money to save and create jobs and to boost student achievement and bridge achievement gaps. New York State received approximately $5.6 billion from ARRA for the period from the 2009-10 school year through fall 2011, and an additional $700 million from the Race to the Top Competition for the period from the 2010-11 school year to fall 2014. New York is of particular interest because it includes New York City, the country’s largest school district. Additionally, New York State has the third largest state school system, serving 5.6 percent of the nation’s students (as calculated by the authors using the National Center for Education Statistics’ Common Core of Data 2009).
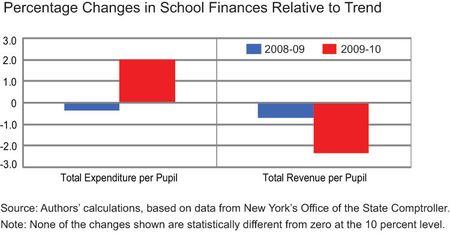
Using rich data from New York’s Office of the State Comptroller on school finance indicators and a trend shift analysis, we analyze the impact of the Great Recession on New York schools. After controlling for pre-existing trends, school district fixed characteristics, and other time-varying socioeconomic characteristics, we do not find much evidence of effects on either total revenue or expenditure. The percentage changes in revenue and expenditure per pupil relative to their respective trends, shown in the chart below, are economically small and statistically not different from zero.
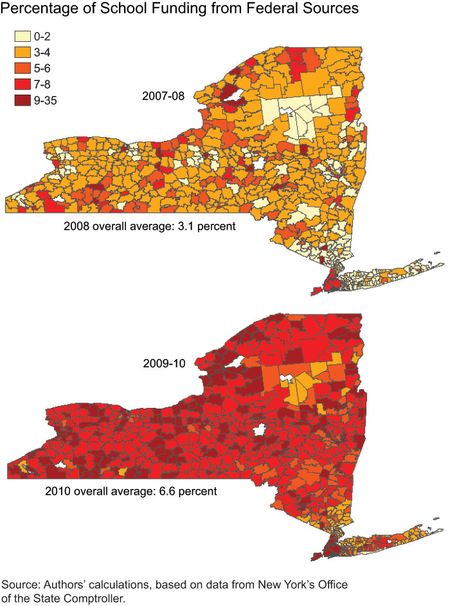
A closer look reveals interesting compositional shifts within both revenue and expenditure. Both federal revenue per pupil and the share of school funds obtained from federal sources more than doubled following the infusion of the ARRA funds in 2009-10, as evidenced by the maps below. The upward shift in federal funding came as state and local revenues shifted downward. The ARRA funds, along with increased debt financing by New York State school districts, appear to have successfully mitigated the impact of downward-trending state and local revenue on overall school expenditure.
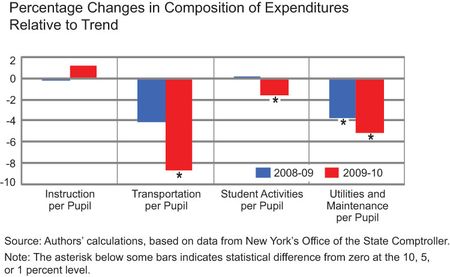
While overall expenditures remained stable, interesting shifts happened within the different spending categories, as can be seen from the chart below. On average, school districts were able to maintain instructional spending per pupil—in fact, there is some evidence of a small increase (relative to trend), although it is not statistically different from zero. Instructional spending includes teacher salaries and other classroom expenditures, and constitutes the expenditure category that matters most for student learning. Since classroom expenditures most directly affect student learning, they are often undesirable targets for budget cuts, and that indeed seems to have been the case in New York. In addition, teacher salaries make up a large portion of instructional spending, and reducing expenditures for teachers is difficult since it involves renegotiating contracts or layoffs. A combination of these factors led to the relative stability of instructional spending in New York. In stark contrast, non-instructional expenditures—especially transportation, utilities and maintenance, and student activities (which include athletics and co-curricular activities)—faced meaningful cuts (often both economically and statistically significant) during the recession.
In summary, we find no evidence of shifts in total school district revenue or expenditure in New York during the Great Recession; however, the composition of both revenue and expenditures changed in important ways. Reliance on federal revenue increased dramatically, while state and local revenue shifted downward in 2009-10. Districts maintained instructional spending per pupil, the expenditure category most directly linked to student learning. Non-instructional expenditures, especially transportation, student activities, and utilities and maintenance, experienced cutbacks.
Considering the slow recovery of economic activity and employment in New York, state and local revenues will likely continue to face downward pressures. Combined with the ending of the federal stimulus money, this trend could significantly depress revenues and expenditures in the future. School districts could face some hard decisions that might involve cutting into the more salient instructional expenditures category. In fact, we can already see the influence of this stress in the current school year. Almost 3 percent of teachers were laid off in the 2011-12 school year. This does not include the 4,000 teacher positions that were left unfilled and the more than 4 percent of school administrators who were laid off in the same year (New York State Council of School Superintendents report [2011]). In total, roughly 11,000 teacher positions were eliminated, accounting for approximately 4.3 percent of teachers.
Thus, recovery of economic activity is likely to be indispensable for the healthy functioning of our schools and an adequate delivery of education services in New York—and in other states as well. If such a recovery doesn’t occur in the near future and policy continues on its current course, these cuts to instructional expenditure may deepen. This could have unpleasant repercussions for student learning and human capital formation, and by extension, our nation’s future.
*Elizabeth Setren is an assistant economist in the Research and Statistics Group.
Disclaimer
The views expressed in this blog are those of the authors and do not necessarily reflect the position of the Federal Reserve Bank of New York, or the Federal Reserve System. Any errors or omissions are the responsibility of the authors.


 RSS Feed
 Follow Liberty Street Economics
At least in New York City, the school system’s focus seems to be anything but student performance. Until that changes at the administrative and teacher reward level, very little is likely to change. The political establishment from the Governor, legislature, Mayor of New York, and City Council have yet to effect meaningful change. Parents are on their own when it comes to securing good educational outcomes for their children.