


Adam Copeland, Isaac Davis,* Eric LeSueur,** and Antoine Martin
The U.S. repurchase agreement (repo) market is a large financial market where participants effectively provide collateralized loans to one another. This market played a central role in the recent financial crisis; for example, both Bear Stearns and Lehman Brothers experienced problems borrowing in this market in the period leading up to their collapse. Unfortunately, comprehensive and detailed data on this market are not available. Rather, data exist for certain segments of the repo market or for specific firms that operate in this market (see this recent New York Fed staff report). The spotty data make it difficult to understand the U.S. repo market as a whole and the relative importance of its different segments. In this post, we draw upon various data sources and market knowledge to provide a map of the U.S. repo market and to estimate its size. We argue that our estimate improves upon the $10 trillion estimate of Gorton and Metrick, which has received substantial press coverage.
An Overview of the U.S. Repo Market
The figure below provides an overview of the various segments of the U.S. repo market. Because repos involve the selling and promised repurchase of securities, securities dealers are at the heart of the repo market, and at the center of our figure. Securities dealers operate in all five repo market segments. Repo segments 2 and 3 are markets where securities dealers borrow cash from investors and provide securities as collateral. Segment 5 is the opposite: securities dealers provide funding to clients or other firms. Not surprisingly, it is not uncommon for dealers to reuse the securities they have received as collateral in segment 5 as collateral for their own borrowing in segments 2 or 3. Finally, securities dealers often redistribute securities and cash among themselves (segments 1 and 4). Segment 1 represents the General Collateral Finance (GCF) Repo market, a blind brokered market primarily for Treasury and agency securities.

We categorize the segments into two groups: tri-party repo (segments 1 and 2) and bilateral repo (segments 3, 4, and 5). The tri-party repo market owes its name to the role played by the clearing banks in facilitating settlement, an arrangement absent from transactions conducted in bilateral repo markets where cash investors and collateral providers perform a direct exchange. Another important difference is that the tri-party repo market is used to finance general collateral, meaning that cash investors do not require a specific security as collateral, but rather accept any security within a relatively broad class. Bilateral repo transactions, by contrast, sometimes allow for general collateral and sometimes impose narrow restrictions on the securities eligible as collateral. Securities dealers choose to transact in tri-party and bilateral repos for different reasons. Our conversations with market participants suggest that tri-party repo is considered more cost efficient, while bilateral is preferred when parties want to interact directly with each other or if specific collateral is requested.
How Big Is Each Repo Market Segment?
One gauge of the importance of each repo market segment is its size, or the amount of collateral posted in that segment. We use various data sources and institutional knowledge to estimate the size of each repo segment.
The Tri-Party Repo Infrastructure Reform Task Force—an industry group sponsored by the New York Fed—provides data on segments 1 and 2 of the tri-party market. Further, primary dealers report information about their financing transactions, including repos, which we use to estimate the total size of the U.S. repo market. The primary dealer data include all repos that use open market operations (OMO)-eligible and corporate collateral, but unfortunately exclude some repo transactions, such as those with asset-backed securities or equity collateral. Our tri-party market data and conversations with dealers indicate that these excluded collateral classes make up a small portion of repo trades. Consequently, we adjust our tri-party data to make it consistent with primary dealer reporting, and note that our segment estimates capture most, but not all, of the repo market. Primary dealers do not comprise the entire universe of securities dealers active in the repo market, but we argue that the vast majority of repo activity is conducted by these dealers. For segments 1 and 2 of the tri-party repo market, the primary dealers represent around 90 percent of the market.
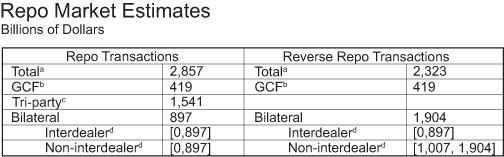
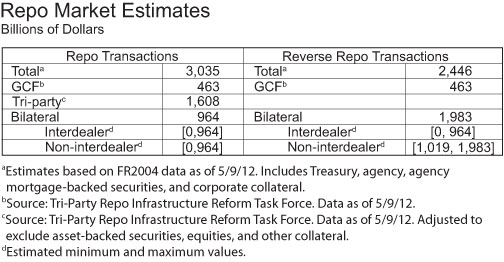
Primary dealers report both their repos and reverse repos (called “reverses” for short). Repos are transactions in which the primary dealer provides collateral (segments 1, 2, 3, and 4), while reverses occur when the dealer provides cash (segments 1, 4, and 5). Extrapolating from tri-party activity, we assume that primary dealers account for 90 percent of all repos and reverses in U.S. repo markets. Hence, by inflating the total repos and reverses of primary dealers by the fraction 10/9, we obtain an estimate of the total size of the respective markets (see the first row in the table).

a Estimates are based on FR2004 data as of May 9, 2012. Includes Treasury, agency, agency mortgage-backed securities, and corporate collateral.
b Source: Tri-Party Repo Infrastructure Reform Task Force. Data as of 5/9/12.
c Source: Tri-Party Repo Infrastructure Reform Task Force. Data as of May 9, 2012. Adjusted to exclude asset-backed securities, equities, and other collateral.
d Figures are estimated minimum and maximum values.
Because we have data on the tri-party market (segments 1 and 2), we can back out an estimate of the size of the bilateral repo market. Unfortunately, we cannot separate out the amount of interdealer repos (segment 4) and the amount of non-interdealer repos (segment 3). We use the same approach to obtain an estimate of bilateral reverse repos.
With these estimates, we can now assess the relative size of the repo market segments. The tri-party and GCF segments dominate the market for repo transactions, accounting for approximately 70 percent of the total. For reverse repos, the bilateral market is largest, accounting for approximately 80 percent of total reverses.
We are able to estimate the minimum and maximum values of the interdealer and non-interdealer components of the bilateral market for repos and reverses. These estimates exploit the fact that interdealer repos must be equal to interdealer reverses, because it is a closed system (for the same reason, each GCF repo is also the reverse GCF repo of another dealer). While these bounds tell us little about the size of non-interdealer repos (segment 3) relative to interdealer repos (segment 4), the bounds do inform us that non-interdealer reverses (segment 5) represent a substantially larger volume than interdealer reverses (segment 4).
A well-publicized and still-cited estimate of total repo market activity is $10 trillion, advanced by Gorton and Metrick in a 2010 paper. This estimate suffers from double counting, however, and furthermore is dated because it captures repo activity in 2008, when the market was larger. While there are strong assumptions underlying our estimates, we believe our estimates provide a more accurate and timely view of the U.S. repo market.
Additional Data on Bilateral Repo Markets Would Be Valuable
Gauging the size of the repo market segments clarifies the importance of what we know and do not know. For repos, we are fortunate to have good publically available data on the market segments that account for 70 percent of total repos (tri-party and GCF). By contrast, we have very little information about the bilateral market. In addition to knowing the size of the bilateral market, it would be valuable to know the type of collateral financed in that market and at what terms. This knowledge could give policymakers a better view of possible risk buildups.
*Isaac Davis is a research associate in the Money and Payments Studies Function of the Research and Statistics Group.
**Eric LeSueur is a trader/analyst in the Market Operations Monitoring and Analysis Function of the Markets Group.
Disclaimer
The views expressed in this post are those of the authors and do not necessarily reflect the position of the Federal Reserve Bank of New York or the Federal Reserve System. Any errors or omissions are the responsibility of the authors.
 RSS Feed
 Follow Liberty Street Economics
Kudos to you on unprecedented work on sizing the US Repo market. This is consistent with the figures I have been using since 2008, when I said that broker/dealer balance sheets had dropped 55-60% after the financial crisis and that the size of the market had gone from about $7 trillion in US in 2007 to about $3-$3.5 trillion in US in 2009. Your diagram does an admirable job at trying to capture the complexity of the market.