In our previous post, we showed that the gap between the market-implied path for the federal funds rate and the survey-implied mean expectations for the federal funds rate from the Survey of Primary Dealers (SPD) and the Survey of Market Participants (SMP) narrowed from the December survey to the January survey. In particular, we provided explanations for this narrowing as well as for the subsequent widening from January to March. This post continues the discussion by presenting a novel approach called “tilting” that yields insights by measuring how much the survey probability distributions have to be altered to match the market-implied path of the federal funds rate. We interpret any discrepancy between the original and tilted distributions as arising from either risk premia or dispersion in beliefs.
Finance theory provides explanations for why the market-implied path of the policy rate may differ from survey measures of policy expectations (see this post by Crump et al.). The market-implied path incorporates both market expectations and risk premia. Even if the marginal investor’s perceived probability distribution for future outcomes coincided with that of the average survey respondent, she might want additional compensation for bearing the risk of unfavorable outcomes. It is conceivable in the current environment that the return of the federal funds rate to a very low level would not be good news for the portfolio of the marginal investor. For this reason, this investor may want insurance against such a scenario. Thus, in assessing the price at which she would be willing to trade interest rate derivatives, she would weight those unfavorable states of the world more than her probability distribution would imply. In other words, the compensation for risk that she requires would pull the market-implied path downward, away from survey expectations. Indeed, negative risk premia are possible in these circumstances, reflecting both the desire to insure against low rate outcomes and the cost of providing insurance for those outcomes. This result is in contrast to observations in the pre-crisis era, when estimated risk premia were usually positive (Piazzesi and Swanson 2008).
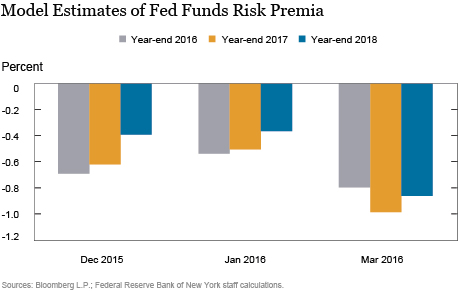
Finance models make a variety of assumptions that allow them to extract risk premia from asset prices and obtain the so-called physical probability distribution of the marginal investor—that is, the probability she assigns to various outcomes. The results from one such model—the Adrian, Crump, and Moench framework (ACM) applied to Eurodollar futures, with an adjustment for the basis between Eurodollars and fed funds—are shown below. ACM suggests that these risk premia are negative and that they modestly shrank toward zero from December to January but substantially declined (in other words, the negative risk premia increased in absolute value) from January to March. The change in risk premia moves in the same direction as the change in the gap between market pricing and survey expectations, although the model-based premia changes are much larger.

Tilting is complementary to the finance approach. It is, in a way, its reverse. Tilting starts from the survey probability distribution and asks: How much do I have to tilt this distribution—that is, how much probability mass do I have to shift around—to obtain the market-implied path as its mean?
There are many ways to tilt a distribution. Our approach requires that the tilted distribution be as close as possible to the original survey distribution, where the notion of distance is one that is commonly used in statistics, called relative entropy or Kullback-Leibler information criterion (also known as KLIC). This relative entropy approach was introduced to the economic forecasting literature by Robertson, Tallman, and Whiteman and used more recently by Altavilla et al., among others.
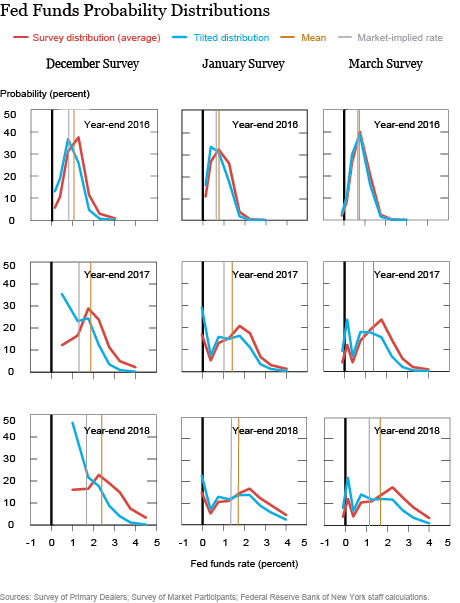
So, what do the tilted survey distributions look like, and how large are the discrepancies with the original probability distributions? The nine panels below show the results for the end of 2016, 2017, and 2018, respectively, using the March (right column), January (middle column), and December (left column) surveys. For each panel, the red line shows the probability distribution averaged across respondents. The vertical gold and gray lines show the survey-implied mean—what we referred to as the PDF-implied mean rate expectation in our previous post—and the market-implied value for the policy rate, respectively. The blue line shows the tilted distribution. (Note that this distribution is constructed by tilting the average of respondents’ probability distributions. Alternatively, we could have tilted the probability distribution for each respondent and then averaged across these tilted distributions. While the two approaches do not, in general, deliver the same answer, in this case they almost do.)

We see that the difference between the original and the tilted end-2016 distributions is negligible in the March survey. This result may not be surprising, since the market-implied rate and the survey mean almost coincide. In contrast, larger shifts are required for 2017 and 2018. However, the amount of tilting required for the March survey pales in comparison to that needed for the December survey, shown in the left three panels above (in the December survey, the lowest 2017 bucket was “less than or equal to 1.0 percent” and the lowest 2018 bucket was “less than or equal to 1.5 percent”). In 2017 and especially in 2018, the tilted distributions are very different from the original distributions, with the probabilities in the lowest bin roughly tripling.
How do we interpret the difference between the original survey distribution and the tilted distribution? If we assume that the marginal investor and the average survey respondent share the same probability distribution, this difference loosely captures the additional premium (or discount) associated with future interest rate outcomes. Under this interpretation, the cost of insuring against low policy rate outcomes fell from December to January (because less tilting is required in January than in December), which is consistent with the change in estimated model-based risk premia. From January to March, the increased tilting implies that the cost of this insurance rebounded, which is also broadly in line with changes in model-based premia.
Alternatively, the difference might reflect the disparity between the subjective probability distributions of the marginal investor and the average survey respondent—and therefore measure the dispersion in beliefs between the two. Under this interpretation, the marginal investor in the futures market was much more pessimistic (in other words, placed more probability on low rate outcomes) than the average survey respondent in December, while by January the average survey respondent revised her beliefs downward. Note that the marginal investor in the futures market likely changes over time, and this change can be an additional source of fluctuations in the gap between market-implied rates and mean projections.
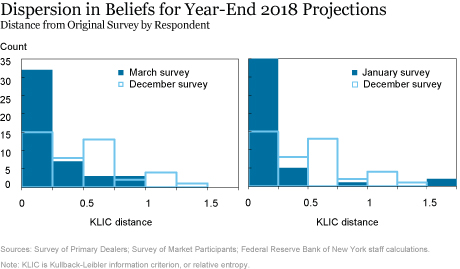
We have no direct measure of the beliefs of the marginal investor. But we can obtain evidence on whether the dispersion in beliefs fell from December to March by looking at the dispersion of beliefs within survey respondents—that is, seeing how much the KLIC varies across respondents. A high (low) KLIC means that the respondent’s forecast distribution requires substantial (little) tilting to deliver the market-implied rate. The left panel in the chart below shows the KLIC distribution across respondents for the 2018 projections in December (light blue) and January (dark blue). It is clear that dispersion in beliefs fell dramatically between the two surveys. The right panel shows that dispersion increased slightly from January to March but remains below the December levels.

In sum, the differences between market-implied rates and the survey mean expectations can be measured by how much we need to tilt the survey distribution in order to obtain the market-implied path as its mean. We interpreted the difference between the original and the tilted distribution as arising from either risk premia or dispersion in beliefs. We provided evidence that the belief dispersion fell between December and January, suggesting that survey respondents converged on a more pessimistic assessment of the economy. The widening of the gap between January and March seems more likely to be attributable to changes in risk premia, since the distributions changed very little between the two surveys.
Disclaimer
The views expressed in this post are those of the authors and do not necessarily reflect the position of the Federal Reserve Bank of New York or the Federal Reserve System. Any errors or omissions are the responsibility of the authors.

Bonni Brodsky is a policy and market analysis associate in the Federal Reserve Bank of New York’s Markets Group.
 Marco Del Negro is an assistant vice president in the Bank’s Research and Statistics Group.
 Joseph Fiorica is a senior analyst in the Bank’s Markets Group.
 Eric LeSueur is a manager in the Bank’s Markets Group.
 Ari Morse is a quantitative policy and market analysis associate in the Bank’s Markets Group.
 Anthony P. Rodrigues is a quantitative policy and market analysis senior associate in the Bank’s Markets Group.


 RSS Feed
 Follow Liberty Street Economics