In Monday’s post, we described the estimation of real wage growth rates for different cohorts of U.S. workers. We showed that the life-cycle pattern of real wage growth is characterized by high growth early in a worker’s career, little to no growth in mid-career, and negative growth as workers near retirement. We also documented that a growing fraction of the U.S. adult population is transitioning into the flat to negative real wage growth phases of their careers. Here, we turn our attention to estimating the effect of this demographic shift on the economy-wide average real wage growth rate. Our analysis shows that this economy-wide average real wage growth rate has declined by a third since the mid-1980s.
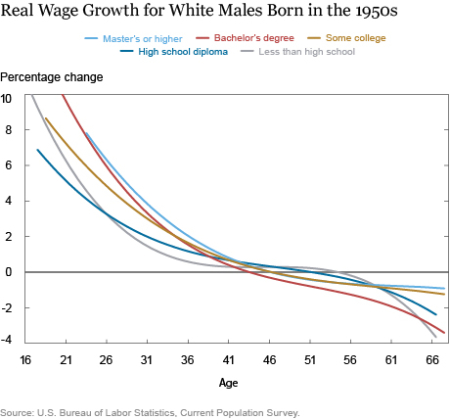
As discussed in our recent post, real wages, holding constant any cyclical effects, show positive growth that is concentrated early in a worker’s career. By age 40, real wage growth has typically declined to around zero. The following chart, reproduced from Monday’s post, depicts this pattern for the five cohorts of white males born in the 1950s by different education levels.

This life-cycle pattern of real wage growth combined with the aging of the U.S. adult population suggests that average real wage growth in the economy would be slowing. How fast and pronounced is this slowing due to changing demographics? To answer this question, we need to be careful to “hold constant” the state of the labor market over time by removing the effects of cyclical factors. Why do this? There are two channels through which the state of the labor market can affect average real wage growth for the economy. The first is that tighter labor markets, all else the same, should increase real wage growth for workers relative to what would be expected from a neutral or slack labor market. The second is that the degree of tightness or slackness in the labor market affects the likelihood that different types of workers are employed. For example, workers with less education and at an earlier career stage are more likely to experience unemployment in a slack labor market. Therefore, we need to control for both of these channels to isolate the economy-wide impact of demographics on real wage growth. We derive our assessment of the effect of population aging on real wage growth under the condition of a neutral labor market. It turns out that this is an especially convenient benchmark now because most current assessments suggest that the U.S. labor market is very close to neutral.
In Monday’s post, we explained how our methodology for estimating the 140 cohort-specific real wage profiles controls for cyclical factors relating to tight or slack labor markets. Consequently, the real wage growth rates for the five cohorts shown above should be interpreted as what workers in those cohorts would expect to experience on average at each age in a neutral labor market.
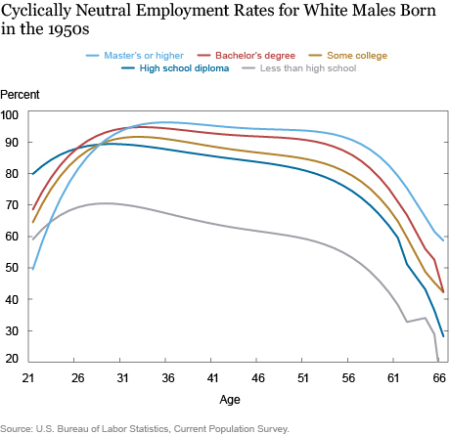
To derive the “cyclically neutral” aggregate average real wage growth, we also need the likelihood that individuals would be working at each age within a neutral labor market. In an earlier post assessing labor market slack, we discussed how to estimate these employment rate profiles so that they reflect a neutral labor market. The next chart shows the resulting employment rate profiles for our earlier five cohorts.

Employment rates increase with the level of an individual’s education and tend to peak early in the career. As an individual approaches retirement, the employment rate declines at an increasing rate.
We now have the necessary pieces to construct the cyclically neutral aggregate average real wage growth series, with our estimate based on the following procedure. For each year and month, we use our sample of individuals from the Current Population Survey (CPS) described in Monday’s post. For each individual, we use his/her cohort and age to identify an expected employment rate and an expected real wage growth rate. Since the CPS is a random sample, each worker is assigned a sample weight reflecting how many people in the population that individual represents. We combine these three elements by multiplying the individual’s employment rate, real wage growth rate, and sample weight.
For illustrative purposes, consider an individual from the CPS who according to the sample weight represents 100,000 people in the U.S. population. Regardless of this individual’s actual employment status at the time of the survey, we assign a predicted employment rate to the individual based on his/her cohort and age. If we assume this employment rate is 0.6, then this person would represent 60,000 employed individuals in a neutral labor market. Next, we assign the predicted real wage growth rate based on this person’s cohort and age to each of these 60,000 individuals. Averaging across all individuals in the CPS survey for that month gives us the expected economy-wide real wage growth rate associated with a neutral labor market at that point in time. We then repeat this exercise for each year/month in our estimation period.
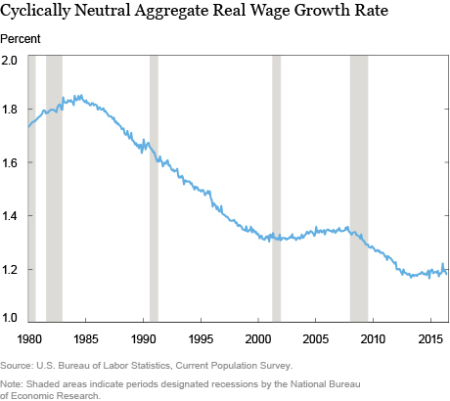
The following chart provides the answer to the question of how changing demographics affect real wage growth over time. The analysis suggests that this cyclically neutral aggregate real wage growth rate peaked in the mid-1980s at around 1.8 percent. Over the subsequent thirty years, the changing demographics and aging of the U.S. adult population has reduced this real wage growth rate to around 1.2 percent—a 33 percent decline.

The analysis also suggests that the pace of the decline has not been uniform over the three decades with the average leveling out in the 2000s. Readers should keep in mind that this measure is an average of individual real wage growth rates, which is not the same as the growth rate of an index tracking an average real wage. Thus, the aggregate average real wage growth series we derive is not directly comparable to growth rates in real compensation per hour, average hourly earnings, or the employment cost index.
So what does all of this mean? We have shown that U.S. real wage growth has been slowing down over the past thirty-five years with the aging of our workforce. Abstracting from cyclical factors impacting the labor market, this slowing is likely to continue in the years ahead as more individuals near retirement and experience negative real wage growth. Again, it is important to keep in mind that the degree of this slowing is specific to our measure of average real wage growth. Moreover, real wage growth should reflect labor productivity growth over long periods of time. An important component of labor productivity growth reflects job matching and on-the-job learning which is front-loaded in a worker’s career. Consequently, the aging of the U.S. population will continue to act as a headwind to labor productivity and wage growth.
Disclaimer
The views expressed in this post are those of the authors and do not necessarily reflect the position of the Federal Reserve Bank of New York or the Federal Reserve System. Any errors or omissions are the responsibility of the authors.
 Robert Rich is an assistant vice president in the Federal Reserve Bank of New York’s Research and Statistics Group.

Joseph Tracy is an executive vice president and senior advisor to the president of the Federal Reserve Bank of New York.
Ellen Fu is a former senior research analyst in the Bank’s Research and Statistics Group.
How to cite this blog post:
Robert Rich, Joseph Tracy, and Ellen, “U.S. Real Wage Growth: Aging’s Effect on the Average,”
Federal Reserve Bank of New York Liberty Street Economics (blog), September 28, 2016, http://libertystreeteconomics.newyorkfed.org/2016/09/us-real-wage-growth-slowing-down-with-age.html.


 RSS Feed
 Follow Liberty Street Economics
In reply to TK: Thank you for your comment. We capture this demographic trend by allowing education completion to be one of the characteristics of our cohorts. As we show in the first chart of Monday’s post, more education raises the life-cycle real wage profiles of workers—that is, the level of the series. However, as shown in the second chart of Monday’s post, the implied life-cycle real wage growth rates are more similar by education. Thus, over time as higher percentages of the population have college degrees or more in education, this would be expected to raise the aggregate real wage level, but would have less of an effect on aggregate real wage growth.
Certainly, due to demographic shift the overall wage growth is expected to be on downward trend. I was wondering how would you incorporate impact from increasing percent of population with higher education. As more percent of employed population moves from high-school or lower education cohort to college education cohort, this must boost the overall wage increase. Do you think this shift helps in opposite impact of demographic shift or the pace at which population is moving into college degree is just too slow to have some meaningful impact.