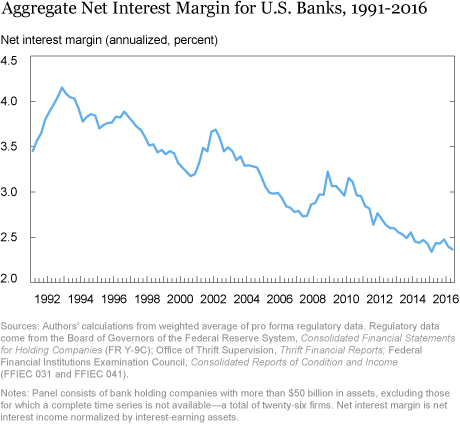
The Fed’s December 2015 decision to raise interest rates after an unprecedented seven-year stasis offers a chance to assess the link between interest rates and bank profitability. A key determinant of a bank’s profitability is its net interest margin (NIM)—the gap between an institution’s interest income and interest expense, typically normalized by the average size of its interest-earning assets. The aggregate NIM for the largest U.S. banks reached historic lows in the fourth quarter of 2015, coinciding with the “low for long” interest rate environment in place since the financial crisis. When interest rates fall, interest income and interest expenses tend to fall as well, but the relative changes—and the impact on NIM—are less clear. In this post, we explore how NIM fell during the low-interest-rate period, finding that banks mitigated some, but not all, of the impact of lower rates by shifting into less costly types of liabilities. Our analysis also gives insight into how NIM may respond to the new rising interest rate environment.
Banks Are Less Profitable When Term Spreads and Interest Rates Are Low
Banks are in the business of maturity transformation, lending over long horizons and taking deposits over short horizons. In theory, their profitability should depend on the term spread—the difference between long- and short-term rates. In practice, bank profitability seems to move with both the term spread and the level of interest rates.
We begin our analysis by examining how NIMs varied with the term spread between 1991 and 2016 for the largest U.S. bank holding companies (BHCs). We begin with the BHCs now subject to Dodd-Frank stress tests and analyze a panel of twenty-six firms that we can adjust for mergers carried out during that twenty-five-year period. Adjusting for mergers is important because the average BHC in this panel acquired thirty other banks from 1991 onward, and the resulting pro forma data set combines data for each entity’s eventual components from 1991 onward.
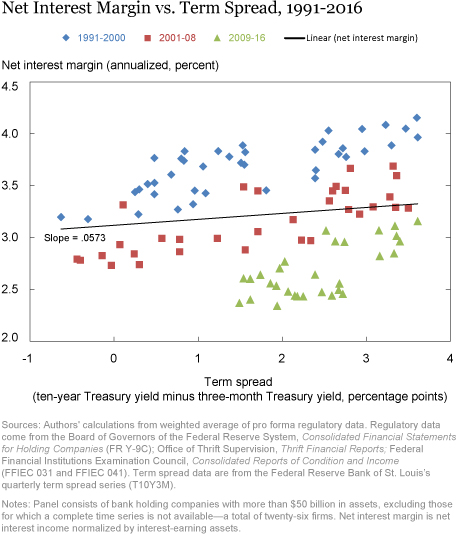
The chart below shows that NIM and the term spread are weakly positively correlated, both over the full period (the black line) and over three subperiods (1991-2000, 2001-08, 2009-16). Notice, however, that NIMs were lower during the low-for-long period of 2009-16 than they were in earlier years, even when the term spread was the same. This suggests that NIM also depends on the level of rates.
Several studies find that NIMs are lower when interest rates are low, particularly when rates approach zero. Claessens, Coleman, and Donnelly document this pattern across forty-seven countries and speculate that NIMs compress in low-interest-rate environments because banks avoid “offering” negative deposit rates. Gesnay and Podjasek discuss this topic in the U.S. context, while Covas, Rezende and Vojtech show that NIM compression during the post-crisis period has been particularly severe at large banking firms like those we analyze. Below, we investigate in more detail how banks’ net interest margins vary with the term spread and level of rates, showing that the impact on NIM is a product of both rate levels and shifts in banks’ balance sheet composition.
Changing Asset/Liability Mix
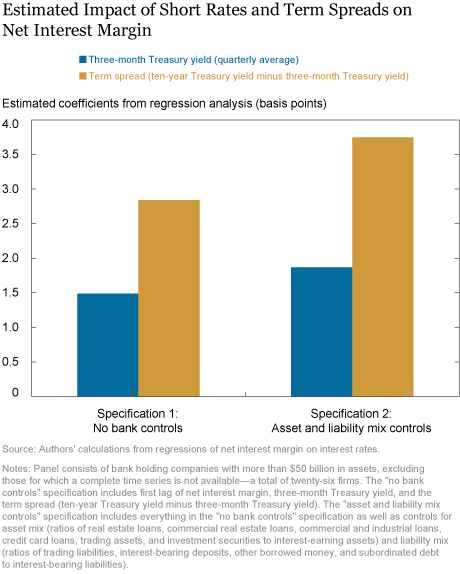
The chart below presents the estimated coefficients from regressions of NIM on the level of rates (the three-month Treasury rate) and the term spread (the ten-year Treasury rate minus the three-month Treasury rate). The first pair of coefficients are estimated without controlling for the composition of banks’ asset and liability holdings. Both coefficients are positive and statistically significant, but the term spread coefficient is twice as large as the coefficient on the interest rate. When we control for the asset and liability mix at each BHC (see chart notes for the full list of variables considered), both coefficients increase substantially. The larger impact in the second case implies that banks were able to mitigate the effects of falling short rates and a compressed term spread by changing their asset and liability mix.
Balance-Sheet Shifts
Below, we break down the assets held by the BHCs in our panel into six categories: loans, investment securities, trading assets, federal funds sold and repos purchased, interest-bearing balances, and all other assets.
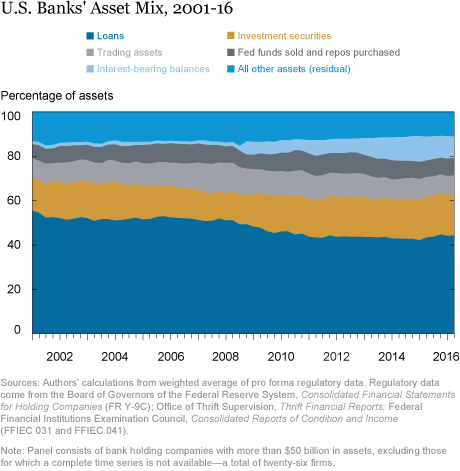
Since the financial crisis, we can see that these institutions have shifted their portfolios away from loans toward other types of interest-bearing assets (like reserves at the Federal Reserve) and investment securities, making their assets lower yielding (Claessens, Coleman, and Donnelly). Moreover, since interest-bearing balances and investment securities have shorter horizons than loans, a shift from the latter toward the former will cause banks’ income to grow faster than it had historically if interest rates change because a smaller percentage of interest-bearing assets are bound by fixed pricing.
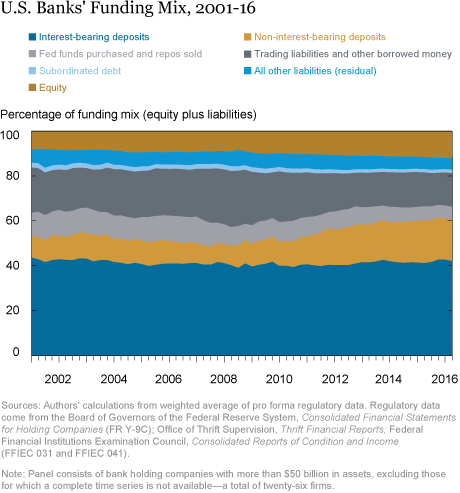
As rates fell with the onset of the crisis, the decrease in interest income was initially offset by a decrease in interest expense. In the chart below, we plot banks’ equity and liability mix, the largest component of which is interest-bearing deposits—the biggest short-term funding source for most banks. We further break down liabilities into five subcategories: non-interest-bearing deposits, federal funds purchased and repos sold, trading liabilities and other borrowed money, subordinated debt, and all other liabilities.
The chart shows that large banks’ liability mix has also changed since 2009. Common equity increased from 9.5 percent to 11.5 percent of liabilities. An even larger change is seen in the composition of deposits, with those that do not pay interest, such as checking accounts, growing from 18 percent to 30 percent of the total. Replacing funding that pays interest with funding that does not is obviously less costly for banks and helps to mitigate declines in interest income yields. However, non-interest-bearing deposits may be more flighty, and thus a less reliable source of funding.
NIM Falls Despite Shift in Funding Mix
While these changes mitigated the effects of low rates and a flat yield curve, deliberately or not, banks were not able to offset them entirely. The chart below decomposes the change in NIM, expressed as the yield of net interest income (net interest income normalized by total assets), between 2009 and 2015 in terms of changes in interest rates and shifts in banks’ asset/liability mix. The rate change arrows reflect only the changes in NIM that are due to changes in interest income or interest expense, while holding banks’ balance sheet mix constant at 2009 levels. The red arrow on the left shows that NIM fell by 1.07 percentage points (36 percent) as a consequence of lower interest rates and the resulting decrease in interest income. The next arrow shows that the decline in banks’ expenses owing to lower rates increased NIM by 0.60 percentage points (20 percent of the 2009 value) but only partly offset the decline in interest income. This partial offset is consistent with the work of Driscoll and Judson (2013) and others, who find that yields on assets respond more quickly to changing financial conditions than yields on liabilities, particularly when interest rates are falling.
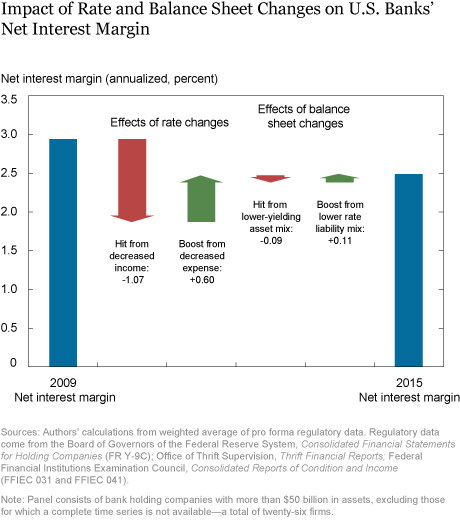
The next pair of arrows reflect the changes to banks’ asset/liability mix that also affect NIM. On net, these changes marginally improved NIM (by 0.02 percentage points overall), but not enough to counter the negative effect of lower interest rates. As a result, NIM was 16 percent lower in 2015 than in 2009.
This decomposition reinforces our earlier finding that as low interest rates persisted, changes in the liability mix of the largest banks were not enough to offset the impact on NIM. Most of these large banks were already paying below-average deposit rates (compared to the industry overall) before the crisis, so as Covas, Rezende, and Vojtech (2015) point out, they likely had little room to lower rates even further once the the low-rate era began.
Looking Forward
If interest rates continue rising, the key question for banks’ profitability is whether interest income will rise more than interest expense. The answer depends in part on whether banks shift back to their pre-2009 mix of assets and liabilities, and whether savers continue to leave deposit funds in accounts that do not bear interest even as rates increase. If the end of the low-for-long era has arrived, then NIM should have finally reached its low.
Disclaimer
The views expressed in this post are those of the authors and do not necessarily reflect the position of the Federal Reserve Bank of New York or the Federal Reserve System. Any errors or omissions are the responsibility of the authors.
 Katherine Di Lucido is a senior research analyst in the Federal Reserve Bank of New York’s Research and Statistics Group.
 Anna Kovner is a vice president in the Bank’s Research and Statistics Group.
 Samantha Zeller is a senior research analyst in the Bank’s Research and Statistics Group.
How to cite this blog post:
Katherine Di Lucido, Anna Kovner, and Samantha Zeller, “Low Interest Rates and Bank Profits,” Federal Reserve Bank of New York Liberty Street Economics (blog), June 21, 2017, http://libertystreeteconomics.newyorkfed.org/2017/06/low-interest-rates-and-bank-profits.html.


 RSS Feed
 Follow Liberty Street Economics
“Hit from decreased” income assumes that a BHC holds its 2009 asset mix, but earns its 2015 rates on its components of interest income. Similarly, “Boost from decreased expense” assumes that a BHC is funded by its 2009 liability mix, but pays its 2015 rates on its components of interest expense. “Hit from lower yielding asset mix” measures the impact of changes to the BHC’s asset mix between 2009 and 2015, and “Boost from lower rate liability mix” to the impact of changes to BHC’s liability mix between 2009 and 2015.
How was the decomposition in NIM from 2009 to 2015 calculated? I may have missed it, but I didn’t see the method for it.
“NIMs” for commercial banks (an oxymoron). In the first place all savings originate within the confines of the commercial banking system. And saver-holders never transfer their funds outside of the payment’s system unless they hoard currency or convert to other National currencies. The point is that from the standpoint of the economy and the payment’s system, all primary deposits to any given member bank are derivative deposits to the system. The source of time (savings) deposits is other bank deposits, typically demand deposits, directly or indirectly via the currency route, or thru the DFI’s undivided profits accounts. From the system’s belvedere, time deposits for the DFIs, are not a source of loan-funds, rather they are the indirect consequence of prior bank credit creation, a shift in the “mix” of DFI deposit liabilities. An increase in time/savings accounts depletes transactions deposits by the same amount – – and the source of demand deposits can largely be accounted for by the expansion of commercial bank credit. The fact is that commercial bankers pay interest for their core deposits, which they redistribute, that the system already holds. And this pervasive error metastases from there. All DFI savings are dormant, un-used and un-spent, lost to both consumption and investment. I.e. the DFIs pay for their new earning assets with new money (that didn’t previously exist). Unless saver-holders transfer their savings through non-bank conduits (matching savings with borrowers), money velocity falls, and N-gDp falls. I.e., unless savings are expeditiously activated and put back to work outside of the payment’s system, a dampening economic impact is inexorably exerted. This is the unique source of both stagflation and secular strangulation. I.e., savings flowing through the non-banks never leaves the payment’s system. There is just a change in the ownership of existing commercial bank deposit liabilities. The NBFIs are the DFI’s customers. Whether the public saves, dis-saves, chooses to hold their savings in the commercial banks or to transfer them to a non-bank will not, per se, alter the total assets or liabilities of the commercial banks, nor alter the forms of these assets and liabilities. The commercial banks could continue to lend even if the non-bank public ceased to save altogether.
I have received a number of messages from readers about the long-time downward trend in NIMs seen in the first chart of this post and the possible implications if short-term interest rates continue to rise. Here is what we know about this issue so far. When modeling NIM in aggregate, we estimate a statistically significant and negative time trend in our top-down model of bank capital (see Appendix Table 1 of this paper published in the Journal of Banking and Finance) http://www.sciencedirect.com/science/journal/03784266/69/supp/S1 In separate unpublished work, we modelled NIM separating out the relationship of each NIM component to rates (i.e. separately modelling components of interest income and interest expense). In these component models, we generally no longer estimate statistically significant time trends, which suggest to me that most of the secular decline in NIM is mix driven. However, it is hard to empirically separate the post-financial crisis time period from the low interest rate period, since the two coincide until basically now, so only when interest rates go up can these two possibilities be fully separated.
This may be the key to understanding why the FMOC has been reluctant to provide enough monetary stimulus to achieve its inflation target since 2008 and the premature increase in interest rates since December 2015.
Let me make sure I understand this point: When the Fed lowers interest rates (by increasing reserves), banks change their asset mix (by holding more reserves)? And when the Fed increases reserves by a lot, banks change their asset mix toward reserves by a lot. Kind of a drawback to a closed system, isn’t it? Two cheers for the reverse repo program.