In January 2014, the U.S. Treasury Department made its first sale of floating rate notes (FRNs), securities whose coupon rates vary over time depending on the course of short-term rates. Now that a few years have passed, we have enough data to analyze dealer trading and positioning in FRNs. In this post, we assess the level of trading and positioning, concentration across issues, and auction cycle effects, comparing these properties to those of other types of Treasury securities.
Background on Floating Rate Notes
FRNs are fixed-principal securities with original maturities of two years that make quarterly interest payments tied to auction rates on thirteen-week Treasury bills. They were introduced to broaden the Treasury Department’s investor base and ultimately lower Treasury borrowing costs, as described in this post. The notes were expected to appeal to investors who want to avoid exposure to longer term interest rates, but who want to stay invested in Treasury securities without having to frequently roll over their maturing bills into new bills. To date, FRNs have offered interest rates higher than thirteen-week bills, with the spread (margin) determined at each FRN’s initial auction.
Dealer Trading and Positioning Data
We analyze data the Fed collects from primary dealers, via FR 2004 reports, on their trading, positioning, financing, and settlement activities in Treasury securities and other fixed income securities, information the Fed aggregates across dealers and releases. Historically, data were only available for broad categories of securities, but the Fed started releasing information for specific Treasury issues in 2013. FR 2004 data have been analyzed in past studies of dealers’ position taking, financing activities, and settlement stresses.
FRN Trading Activity
As shown in the chart below, total dealer trading volume in FRNs averages $2.6 billion per day over our thirty-three-month sample period (the week ending January 7, 2015 to the week ending October 11, 2017). Thus, during this period, FRNs accounted for only about 0.5 percent of trading in all Treasury securities (which averaged roughly $500 billion per day over our sample), whereas they accounted for about 1.3-2.4 percent of Treasury securities outstanding. The lower trading activity of FRNs is consistent with their appeal as investments to be held to maturity, rather than as vehicles for hedging positions in other securities or speculating on interest rates.
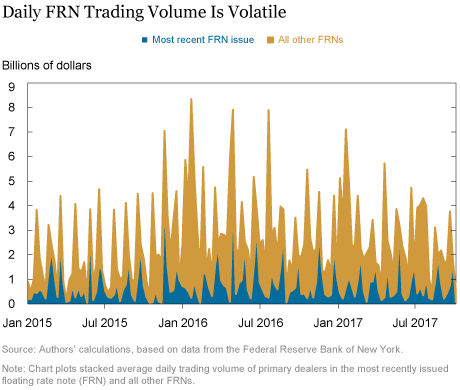
The chart also shows that the most recently issued FRN accounts for about 33 percent of trading in all FRNs. In contrast, this post found that the most recently issued security accounts for 52-85 percent of activity in its sector (depending on the security) for regular notes and bonds. Moreover, we find that 26 percent of trading in the most recently issued FRN trades through an interdealer broker (IDB), whereas the comparable figure for the regular two-year note is 50 percent. The lower share of trading in the most recently issued FRN, and through an IDB, provides further evidence that FRNs are not used as trading vehicles to the same extent as other types of Treasury securities.
Analysis of Positions
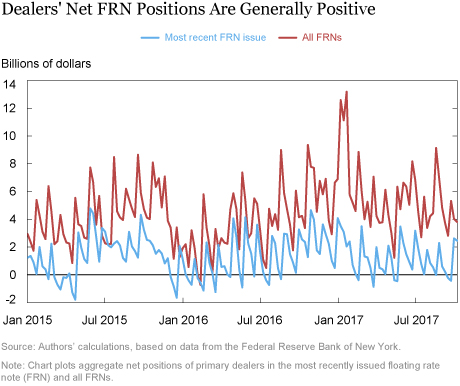
The next chart reveals that dealers’ aggregate net position (long – short) in FRNs as a group is nearly always positive, averaging $4.5 billion. In contrast, for the most recently issued FRN, positions are nearly always lower (averaging $1.3 billion) and frequently negative, consistent with the recently issued notes being used to speculate on interest rates or hedge positions in other securities. Nonetheless, this post finds dealers’ positions in regular notes to be more negative, suggesting that those notes are used more actively for such purposes.
Effects of Auctions on Trading and Positions
The charts above also demonstrate the high volatility and apparent cyclicality of FRN trading and positions—possibly a reflection of auction effects. This paper and this blog post show that auctions are an important determinant of dealer positioning in regular Treasury securities, and this paper finds that they spur additional trading volume in Treasury Inflation-Protected Securities.
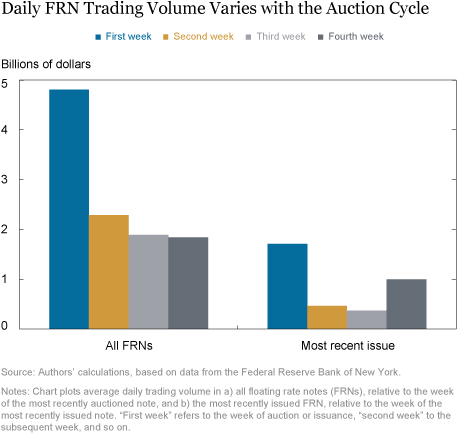
The next chart shows how daily FRN trading volume changes over the monthly auction cycle. Because of differences in data reporting, the weeks are defined relative to the auction date when looking at all FRNs and relative to the issuance date for the most recently issued FRN (the issuance date is one to four business days after the auction date). We find that trading volume in all FRNs varies tremendously over the auction cycle, with volume more than twice as high during the auction week than during any other week. The pattern is generally similar for the most recent issue, with the uptick in the fourth week explained by the effects of the subsequent FRN auction (FRNs are auctioned monthly, so the fourth week since issuance often contains the date of the next auction).
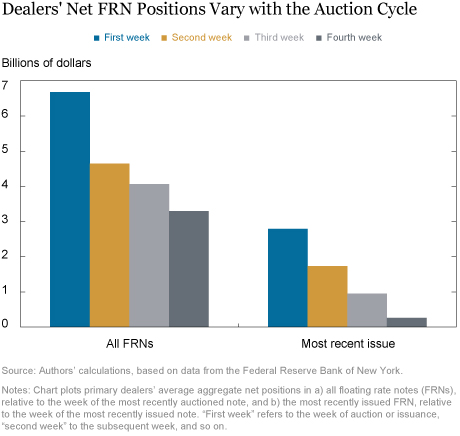
Our last chart also reveals auction cycle effects for dealers’ net positions, in both FRNs as a group and the most recent issue. Net positions are most positive in the week of auction or issuance and then decline in subsequent weeks, consistent with past work and with the early findings in this post. The pattern is consistent with dealers’ underwriting role, in which they buy large shares of newly auctioned securities and sell them off over time to other investors.
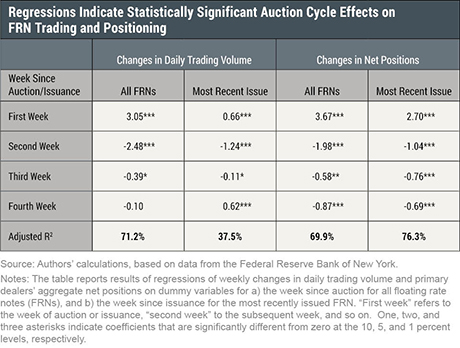
Lastly, we tested the statistical significance of these auction effects by regressing changes in dealer trading volume and net positions on dummy variables indicating the week of auction or issuance and subsequent weeks. The results confirm that volume increases significantly in the auction week and plunges the following week, with the effects strongest for all FRNs, but still significant for the most recent issue. Positions also increase strongly in the week of auction or issuance, and decrease in subsequent weeks. These simple models are able to explain most of the weekly variation in trading activity and positioning across all FRNs, as indicated by the high adjusted R2 statistics.
Summing Up
We find that the level and concentration of activity in FRNs is lower than that of other Treasury securities, consistent with FRNs serving more as investment vehicles than trading vehicles. We find an auction cycle pattern in dealer positions, as found for other Treasury securities, and also a similar pattern for trading volume. Moreover, these auction cycle patterns are strong enough to explain much of the variation in week-to-week changes in dealer trading and positioning.
Disclaimer
The views expressed in this post are those of the authors and do not necessarily reflect the position of the Federal Reserve Bank of New York or the Federal Reserve System. Any errors or omissions are the responsibility of the authors.

Michael J. Fleming is a vice president in the Federal Reserve Bank of New York’s Research and Statistics Group.
Amanda Wahlers, a former undergraduate intern at the Bank, is a student at Washington and Lee University.
How to cite this blog post:
Michael J. Fleming and Amanda Wahlers, “Dealer Trading and Positioning in Floating Rate Notes,” Federal Reserve Bank of New York Liberty Street Economics (blog), March 26, 2018, http://libertystreeteconomics.newyorkfed.org/2018/03/dealer-trading-and-positioning-in-floating-rate-notes.html.


 RSS Feed
 Follow Liberty Street Economics
Nat: Thank you for your comment. The primary dealers report information to the Fed on their trading activity in Treasury securities, broken down by security type and maturity bucket. The Fed publishes this information in aggregated form, available at the following link (scroll down to “Statistical Releases”): https://www.newyorkfed.org/markets/primarydealers
Michael and Amanda- Thanks for your careful analysis. Nice to have ‘back-of-the-envelope’ calculations so methodically confirmed. I was struck by your early comment that daily trading in US securities is roughly $500 billion. That is 5% of the roughly $20.5 trillion in total public Federal debt (FRED series GFDEBTN). Where can I learn more about the composition of that turnover? Thanks- Nat Pulsifer