In response to the financial crisis nearly a decade ago, a number of regulations were passed to improve the safety and soundness of the financial system. In this post and our related staff report, we provide a new perspective on the effect of these regulations by estimating the cost of capital for banks over the past two decades. We find that, while banks’ cost of capital soared during the financial crisis, after the passage of the Dodd-Frank Act (DFA), banks experienced a greater decrease in their cost of capital than nonbanks and nonbank financial intermediaries (NBFI).
The Cost of Equity Capital
The cost of capital reflects the expected return of equity investors. Managers seek to earn or outperform their cost of capital. For banks, the cost of capital drives lending amounts, borrowing rates, and thus real economic activity. How has the cost of capital changed over time in response to changing regulations for banks?
Measuring the cost of capital requires a model because expected (as opposed to realized) stock returns are not observed empirically. In this blog post, we use the Capital Asset Pricing Model (CAPM) to estimate the cost of capital. The CAPM provides a benchmark estimate of expected stock returns from an equilibrium model that is often used by market participants. Our staff report provides additional cost of capital estimates from related multifactor models.
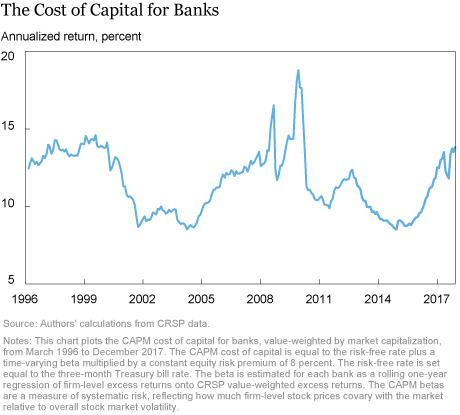
The chart below plots the market value-weighted CAPM cost of capital for banks over time. By this measure, banks’ cost of capital has approached twenty-year lows in recent years, a result that largely reflects the low level of the risk-free rate.
Banks versus Nonbanks
To study how regulatory changes affect the cost of capital for banks, we compare changes in the cost of capital for banks and nonbanks over different time periods separated by key events: the passage of the Gramm-Leach-Bliley Act (GLB, November 1999), the start of the Financial Crisis (Crisis, January 2007), the first release of stress-test results under the Supervisory Capital Assessment Program (SCAP, May 2009), and the passage of the Dodd-Frank Act (DFA, July 2010). This approach allows us to distinguish between outcomes that affect all companies, such as changes to the risk-free rate, and those that affect only banks owing to regulation.
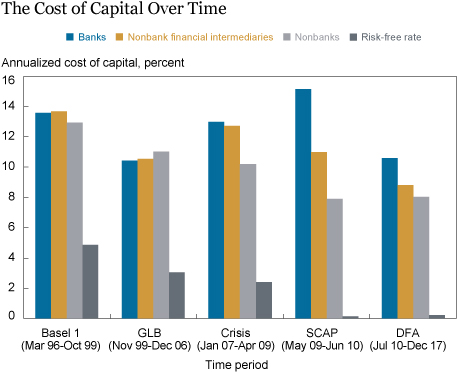
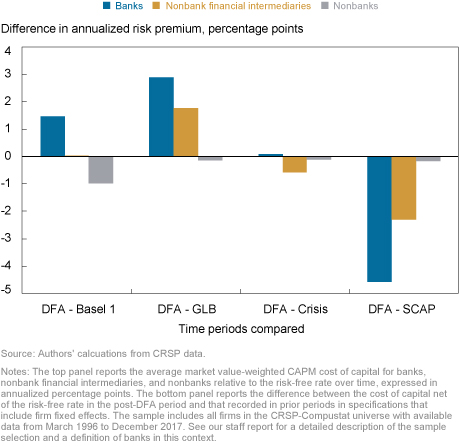
The chart below illustrates our approach by plotting the average market value-weighted CAPM cost of capital for banks (blue), nonbank financial intermediaries (yellow), and nonbanks (light gray) relative to the risk-free rate (dark gray) over these time periods. The upper panel shows levels, while the lower panel documents the change relative to the post-DFA period. The average cost of capital has fallen since the late 1990s for all firms, including banks, as a result of the declining risk-free rate. Beyond this common trend, banks’ cost of capital has declined by an additional 4.5 percentage points relative to that of nonbanks since the financial crisis, a difference that is economically and statistically significant (as discussed in our staff report). However, when comparing the post-DFA period to the period before the repeal of Glass-Steagall (that is, the Basel 1 period), the cost of capital for nonbanks has fallen by about 2 percentage points more than that of banks. This analysis suggests that, while post-crisis regulations may have reduced expected returns for banks from post-crisis highs, after adjusting for the risk-free rate, the cost of capital for banks is higher than it was twenty years ago.
Do Bank-Nonbank Differences Reflect Regulation?
The cost of capital may change differentially for banks for reasons other than changes in regulation. For example, if investors revalue the riskiness of bank assets at the same time that regulations are changing, our initial analysis may spuriously attribute changes in asset betas to regulation, or underestimate the impact of regulation.
To account for this possibility, we take multiple approaches. First, we compare banks to only nonbank financial intermediaries. If the systematic risk of banks is closer to that of nonbank financials rather than nonfinancial firms, nonbank financials will serve as a better control group for our difference-in-differences analysis. Comparing banks and nonbank financials, we find the results are similar: The cost of capital falls more for banks after DFA and remains higher for banks when comparing the current time period to the late 1990s. Since banks may also respond differently to changes in interest rates, we confirm that the results are robust when we control for the level of three-month Treasury bills and the ten-year/two-year Treasury term spread, as well as when we include interest rates as additional factors in modeling expected stock returns.
Top Banks versus Top Nonbanks
Many of the recent financial regulatory reforms, such as the introduction of stress testing, the enhanced supplementary leverage ratio, and the liquidity coverage ratio, apply only to the largest banks. To explore the differentiated effects of such measures, we compare the very largest banks to smaller banks. The DFA requires the Federal Reserve to establish enhanced supervision standards for banks with more than $50 billion in assets—roughly the twenty largest banks in the United States throughout our sample period. Hence, we define “top firms” as the twenty largest firms by assets in an industry at each point in time.
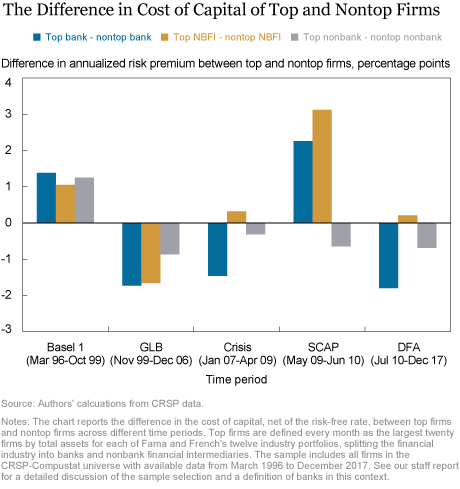
In the chart below, we plot the average market value-weighted difference in the cost of capital between top and nontop banks (blue), top and nontop nonbank financial intermediaries (yellow), and top and nontop nonbanks (gray). The average difference in cost of capital between top nonbanks and smaller nonbanks has been negative since the GLB period. In contrast, while top banks and top nonbank financial intermediaries also enjoyed a lower cost of capital relative to smaller firms in their industries during the GLB period, this pattern reversed dramatically during the height of the crisis. After the passage of the DFA, top banks’ cost of capital has been about 2 percentage points lower than that of smaller banks, while top nonbank financials have about the same cost of capital as smaller nonbank financials. In other words, after the passage of the DFA, the industry most affected by the post-crisis financial regulations, banking, has had the greatest decline in the cost of capital for large firms relative to small firms.
Bank Characteristics and Stress Tests
Since bank regulation affects bank risk, capital, liquidity, and business models, we want to understand how changes in these variables explain the observed changes in the cost of capital. Despite large changes over time in bank characteristics, when we add controls for non-interest income, risk-weighted assets, core deposits, liquidity coverage, and equity (as measured by the Tier 1 capital ratio), the general patterns remain, with banks exhibiting a large decline in their cost of capital after the financial crisis. However, when extending this analysis to allow for a time-varying relationship between expected returns and bank characteristics, we find that changes to the relationship between expected returns and risk-weighted assets are an important driver of changes during the SCAP period. The results suggest that after the financial crisis, market-expected returns for banks with more RWA increased dramatically and then fell again after the passage of the Dodd-Frank Act. In addition, we find some evidence that stress testing has lowered the cost of capital, but only for the largest stress-tested banks.
Effects on Credit Supply
What are the implications of these changes for the real economy? We study this question in the paper by relating changes in banks’ cost of capital to confidential micro survey response data from the Senior Loan Officer Opinion Survey (SLOOS), allowing us to focus on the supply effect at the individual bank level. We find that when banks’ cost of capital decreases, banks loosen loan standards and decrease loan spreads. This result holds both in aggregate for the panel of surveyed banks as well as in the cross section after controlling for business cycle variation. Through this channel, changes in regulation that impact banks’ cost of capital are passed through to the real economy.
Do Changes in the Cost of Capital for Banks Indicate Changes in Systemic Risk?
Since the passage of the Dodd-Frank Act, the cost of capital for the banking industry has fallen significantly relative to that of other industries. However, relative to the pre-GLB time period, banks’ cost of capital is 1 to 2 percentage points higher. To the extent that bank managers rely on cost of capital estimates as hurdle rates, these changes may reflect how the equity market is informing managerial choices, as indicated by the SLOOS analysis. However, it is not clear that we should view these metrics as indicators of systemic risk in the banking sector. Our results indicate that banks’ CAPM cost of capital was lowest in the period leading up to the financial crisis—precisely the years in which ex-post realizations suggest that tail risk was growing in the banking sector.
Disclaimer
The views expressed in this post are those of the authors and do not necessarily reflect the position of the Federal Reserve Bank of New York or the Federal Reserve System. Any errors or omissions are the responsibility of the authors.

Anna Kovner is a vice president in the Federal Reserve Bank of New York’s Research and Statistics Group.

Peter Van Tassel is an economist in the Bank’s Research and Statistics Group.

Brandon Zborowski is a senior research analyst in the Bank’s Research and Statistics Group.
How to cite this blog post:
Anna Kovner, Peter Van Tassel, and Brandon Zborowski, “Regulatory Changes and the Cost of Capital for Banks,” Federal Reserve Bank of New York Liberty Street Economics (blog), October 1, 2018, http://libertystreeteconomics.newyorkfed.org/2018/10/regulatory-changes-and-the-cost-of-capital-for-banks.html.



 RSS Feed
 Follow Liberty Street Economics