


Editor’s note: Since this post was first published, the note on the final chart has been corrected to reflect that, as depicted, gold shares are calculated based on national valuation (June 3, 2024, 9:00 am), and the text has been edited to clarify where the analysis refers to the authors’ sample (June 12, 2024, 1:29 pm).
Global central banks and finance ministries held nearly $12 trillion of foreign exchange reserves as of the end of 2023, with nearly $7 trillion composed of U.S. dollar assets. Nevertheless, a narrative has emerged that an observed decline in the share of dollar assets in official reserve portfolios represents the leading edge of the dollar’s loss of status in the international monetary system. Some market participants have similarly linked the apparent increase in official demand for gold in recent years to a desire to diversify away from the U.S. dollar. Drawing on recent research and analytics, this post questions these narratives, arguing that these observed aggregate trends largely reflect the behavior of a small number of countries and do not represent a widespread effort by central banks to diversify away from dollars.
Central Bank Reserves
Foreign exchange reserves are assets held by a central bank in foreign currency. They often consist of bonds, deposits, banknotes, and government securities, but can also include commodities like gold and silver. Many global central banks choose to hold reserves in foreign exchange to support confidence in their monetary and exchange rate policies, including the capacity to intervene in support of the local currency. As the International Monetary Fund (IMF) discusses, foreign exchange reserves can also absorb pressure on currencies during times of crisis or when access to international borrowing is curtailed, giving markets greater confidence that a country can meet its external obligations.
The IMF’s Currency Composition of Official Foreign Exchange Reserves (COFER) data reports aggregates of the currency composition of foreign exchange reserves held by central banks. The chart below presents the dollar share and the share of the “Big 4” currencies (dollar, euro, yen, and pound), showing that both peaked in 2001. Following the global financial crisis, the U.S. dollar share recovered to 65 percent in 2015, but then saw a 7 percentage point decline from 2015 to 2021.
Dollar Share of Foreign Exchange Reserves Has Declined over Recent Decades
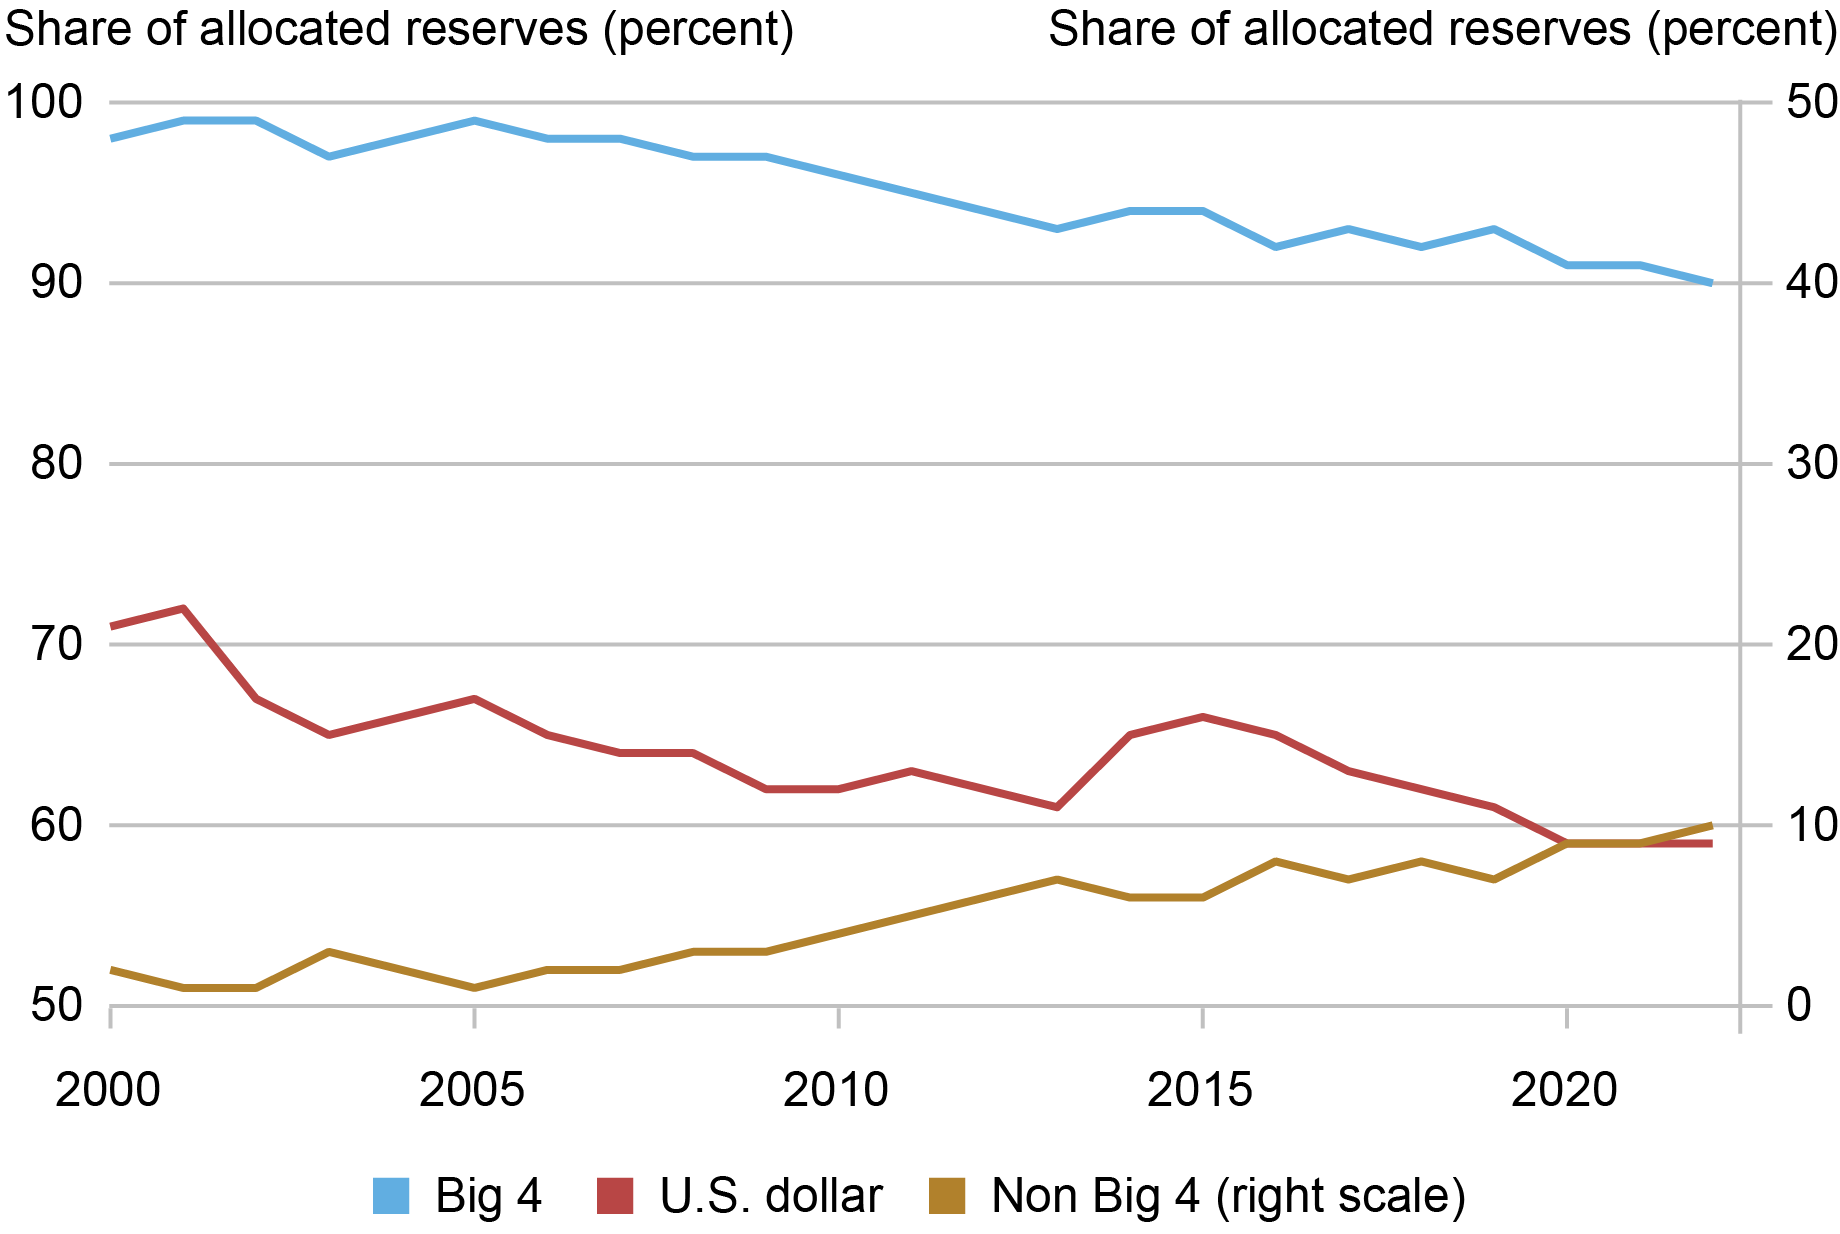
Notes: The chart shows global trends in central bank foreign currency allocations. “Big 4” refers to the U.S. dollar, Japanese yen, euro, and British pound.
A New (Simple) Decomposition Provides Perspective on Reserve Portfolio Changes
New research by Goldberg and Hannaoui (2024) shows that, conceptually, the changes in the dollar share of aggregate reserves are driven by two very different forces. First, the change in preferences for holding dollar assets can evolve at the country level and interact with the initial reserve balance of a country. Second, global aggregates can evolve across periods due to changes in the quantities of reserves held in the portfolios of countries, interacted with their initial dollar portfolio allocation. Thus, countries that see large changes in the size of their reserves and with an initial dollar weight significantly different from the average can contribute substantially to global aggregates of foreign exchange currency shares for reasons unrelated to changes in preferences for holding dollar assets.
Two types of country-level data are used for our 72-country sample, whose foreign exchange reserves spanned two-thirds of the world total as of 2021, to provide insights that further unpack the importance of these factors: country foreign exchange reserves data (IMF International Financial Statistics) and data on the country-level composition of reserves drawn from researcher estimates (Ito and McCauley 2020). Using the latter, one can estimate the components of the 7 percentage point decline in the U.S. dollar global reserve share, across our 72-country sample, observed between 2015 and 2021.
The decline is defined by three parts. First, the weighted sum of the preferences for dollar assets across countries for which there are estimates for both 2015 and 2021 accounts for 0.3 percentage points. In aggregate, this summation explains almost none of the total change in the COFER dollar share. Second, the pattern of accumulation and declines in reserve portfolios explains 3.8 percentage points of the aggregate U.S. dollar share decline. The implication of this analysis is that half of the overall dollar share decline, within our 72-country sample, is not attributable to changes in dollar preferences.
The decomposition allows us to estimate the third part—the portion of the aggregate U.S. dollar share decline in total foreign exchange reserves attributed to changing preferences for dollar assets by countries for which estimated portfolio allocations are unavailable. This total component, dominated by the larger reserves of China and India, accounts for approximately 2.9 percentage points of the 7 percentage point decline in the U.S. dollar share of the total, as estimated from our 72-country sample. These specific estimates could change by including other countries that are missing from our analytics but included within the broader COFER construction.
Looking more closely across country-level data, a small set of countries played a large role in our sample. Switzerland—having raised total reserves by almost half a trillion dollars during this period—contributed nearly 1.8 percentage points to the global allocated U.S. dollar share decline. The observed effect contributed by Switzerland is due to its accumulation of euros, largely as a result of a monetary policy framework that at times limits movements in the euro–Swiss franc pair. This contribution is, then, a story of Swiss monetary policy, and not one of a declining preference for dollar assets. Russia also saw significant foreign exchange reserve growth from 2015 to 2021, increasing its reserve balance by over $150 billion while simultaneously lowering its share of dollar assets by 29 percentage points. This led to an estimated contribution of 1.8 percentage points to the 7 percentage point decline.
The data on estimated portfolio shares show a mix of both positive and negative changes in U.S. dollar asset portfolio shares across countries. It is therefore not the case that countries are moving away from dollars en masse. Indeed, increasing U.S. dollar shares from 2015 to 2021 were a feature of thirty-one of the fifty-five countries for which there are estimates. The decline in the dollar preferences of a small group of countries (notably China, India, Russia, and Turkey) and the large increase in the quantity of reserves held by Switzerland explain most of the decline in the dollar share of reserves observed within our sample.
Do Relative Returns on Assets and Geopolitical Considerations Drive Portfolio Shifts?
We use regression analytics to explore the contributions of standard determinants of the U.S. dollar share of country reserves. The standard determinants include the use of currency pegs; country bilateral trade shares with the U.S., euro area, and Japan; and the currency denomination and level of external debt. Our research finds that the main drivers of portfolio allocations continue to be the traditional ones that stress currency pegs, proximity to the euro area in trade, and debt exposures.
The first new conjecture tested is whether the dollar share will be lower when other reserve currencies have higher returns. To get at the idea that parts of the portfolio might be managed with different strategies, official reserve portfolios are interpreted as composed of a liquidity tranche—needed to meet some short-term objectives in the event of a funding market disruption—and an investment tranche. Liquidity tranche proxies are alternatively defined as three months of country goods and services imports or a country’s short-term liabilities, both of which are approaches to defining minimal reserve balances as provided in guidance from the IMF. The investment tranche is defined as the excess of total official reserves relative to liquidity needs. Accordingly, we also test whether this portfolio tilt from currency returns can be magnified in a low U.S. interest rate environment, and when central banks have a larger investment tranche.
Our research suggests that relative returns on sovereign assets—for traditional and nontraditional reserve currencies—have not played a large role in the dollar share of official reserves. Low interest rate and zero lower bound periods did not significantly magnify or tilt the effects of relative returns on sovereign assets. In addition, relative to past analysis, we find a stronger effect of proximity to the euro area on tilting some portfolios away from dollars.
The second conjecture is that the dollar share can be lower for countries that are geopolitically less aligned with the U.S., at least compared to dollar shares that would otherwise be suggested by their patterns of trade, debt finance, and currency regimes. One part of the explanation might be that these forces are stronger when central bank reserves are larger than their liquidity needs—allowing reserve managers to chase yields. Tests of this conjecture use country voting agreement with the U.S. at the United Nations General Assembly, introduced in continuous form or in discrete categories of agreement (low, medium, or high). Our research finds that geopolitical considerations do play a role in dollar shares, though, surprisingly, they reduce the dollar share mainly when country reserve portfolios are already large enough to meet their potential foreign currency liquidity needs.
How to Interpret the Sharp Rise in Central Bank Holdings of Gold
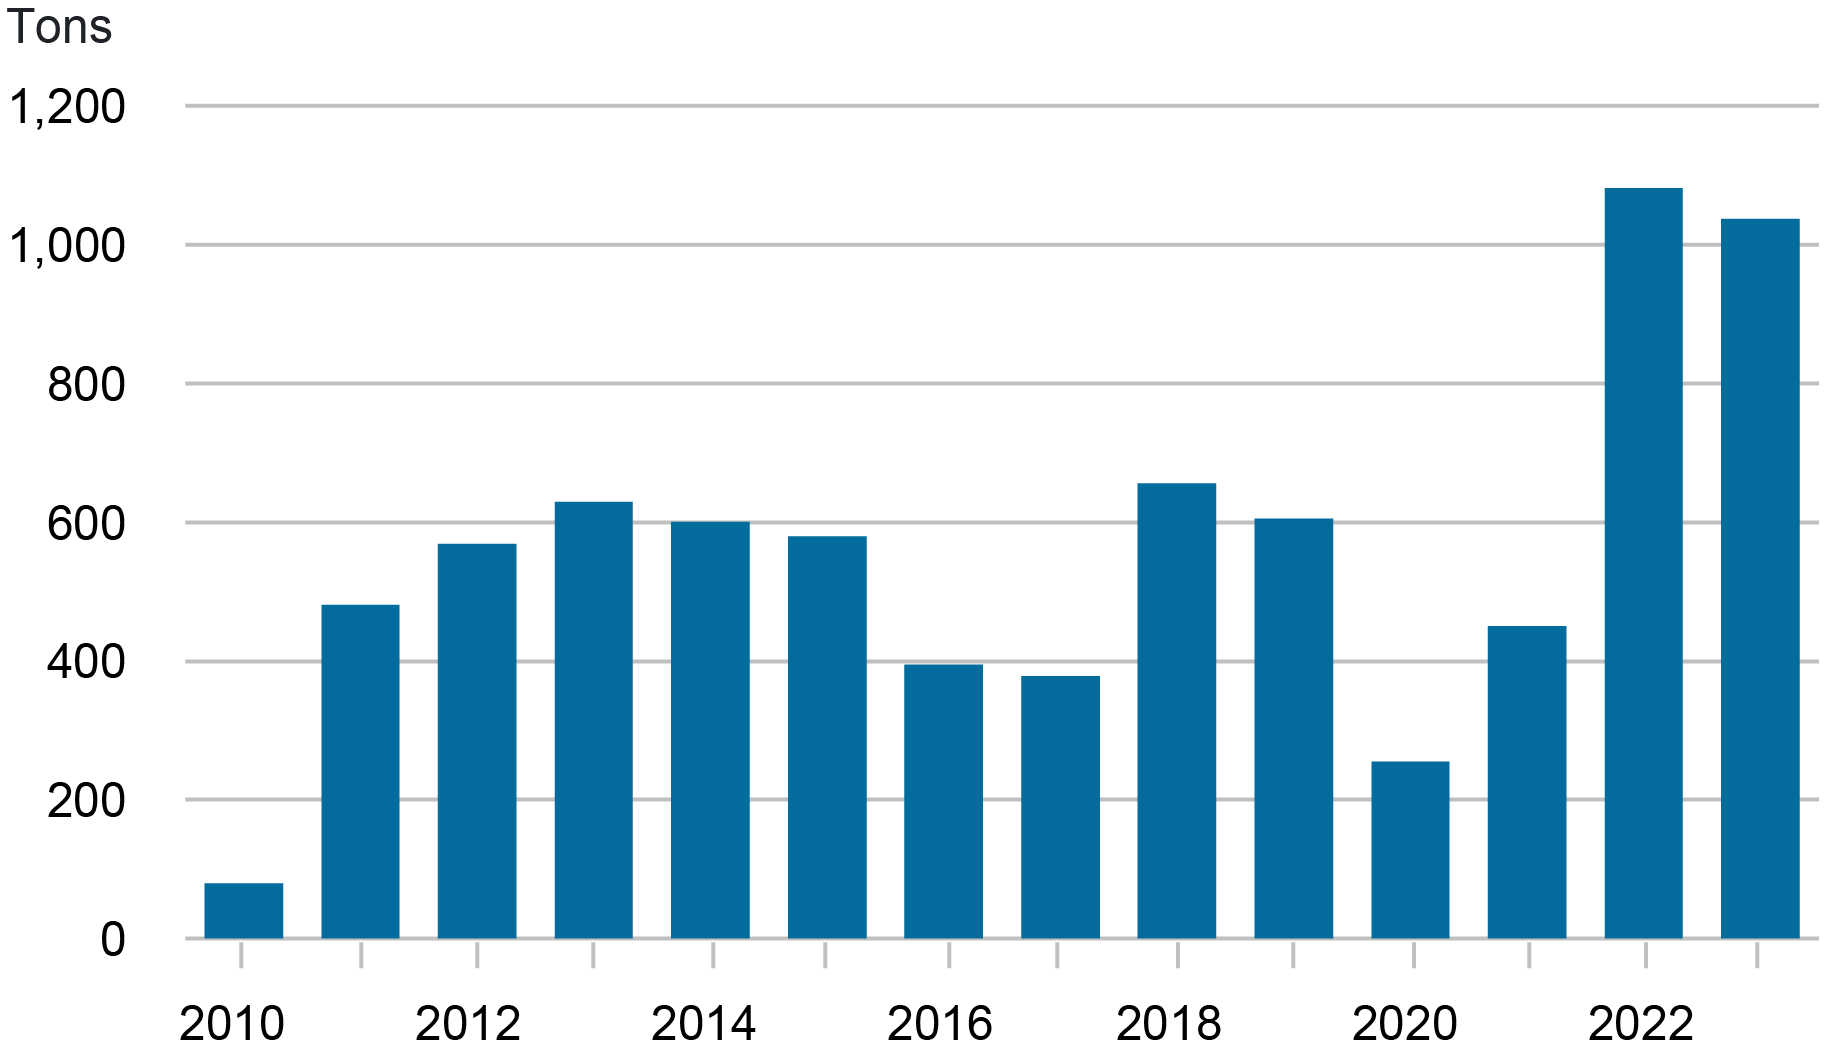
Central banks have increased their gold purchases notably since the global financial crisis, and this trend appears to have accelerated recently. According to World Gold Council data, global central banks purchased over 1,100 tons of gold in 2022—more than double the purchase amounts of the previous year—and maintained a similar purchase level in 2023, as shown in the chart below.
Increases in Global Central Bank Gold Holdings
Market participants have attributed this increased demand to three factors: (1) gold’s perceived value as an inflation hedge amid growing concerns around central bank credibility and independence, (2) gold’s use as a risk hedge, given elevated economic and financial uncertainty, and (3) gold’s use as a sanctions hedge as it has no issuing government.
Gold’s seeming safety from sanctions has been widely viewed as a particularly salient factor behind official gold purchases since Russia’s invasion of Ukraine in 2022 and the G7 countries’ subsequent decision to freeze the foreign exchange reserves of Russia’s central bank and forbid their banks from doing most business with Russian counterparts. Arslanalp, Eichengreen, and Simpson-Bell (2023) provide evidence of the application of multilateral sanctions as a driver for emerging market and developing countries. Central banks themselves have noted sanctions concerns as a driver of gold purchases and of increased vaulting of gold domestically in recent reserve manager surveys. Moreover, we find that countries that are geopolitically less aligned with the U.S.—as proxied with their voting agreement with the U.S. in the United Nations—have tended to be the largest gold purchasers in recent years (though low voting alignment with the U.S. is not a strong predictor of gold accumulation overall).
While these gold purchases are certainly notable, the broader implications for central banks are limited. First, gold’s share of aggregate reserves remains modest at about 10 percent (or 15 percent based on the market valuation of gold), roughly its level in the early 2000s, as shown in the chart below. Second, IMF country-level data suggest that most of the increase in official gold holdings has come from just a few central banks. More than half of reported gold accumulation since 2009 was from China and Russia, with another quarter coming from a handful of emerging market central banks (Turkey, India, Kazakhstan, Uzbekistan, and Thailand). Lastly, gold retains important shortcomings as an alternative to fiat currencies. It bears no interest and, as a physical asset, is difficult to use in transactions, to say nothing of its high transportation, warehousing, and security costs.
Ratio of Gold to Official Foreign Exchange Reserves Remains Low
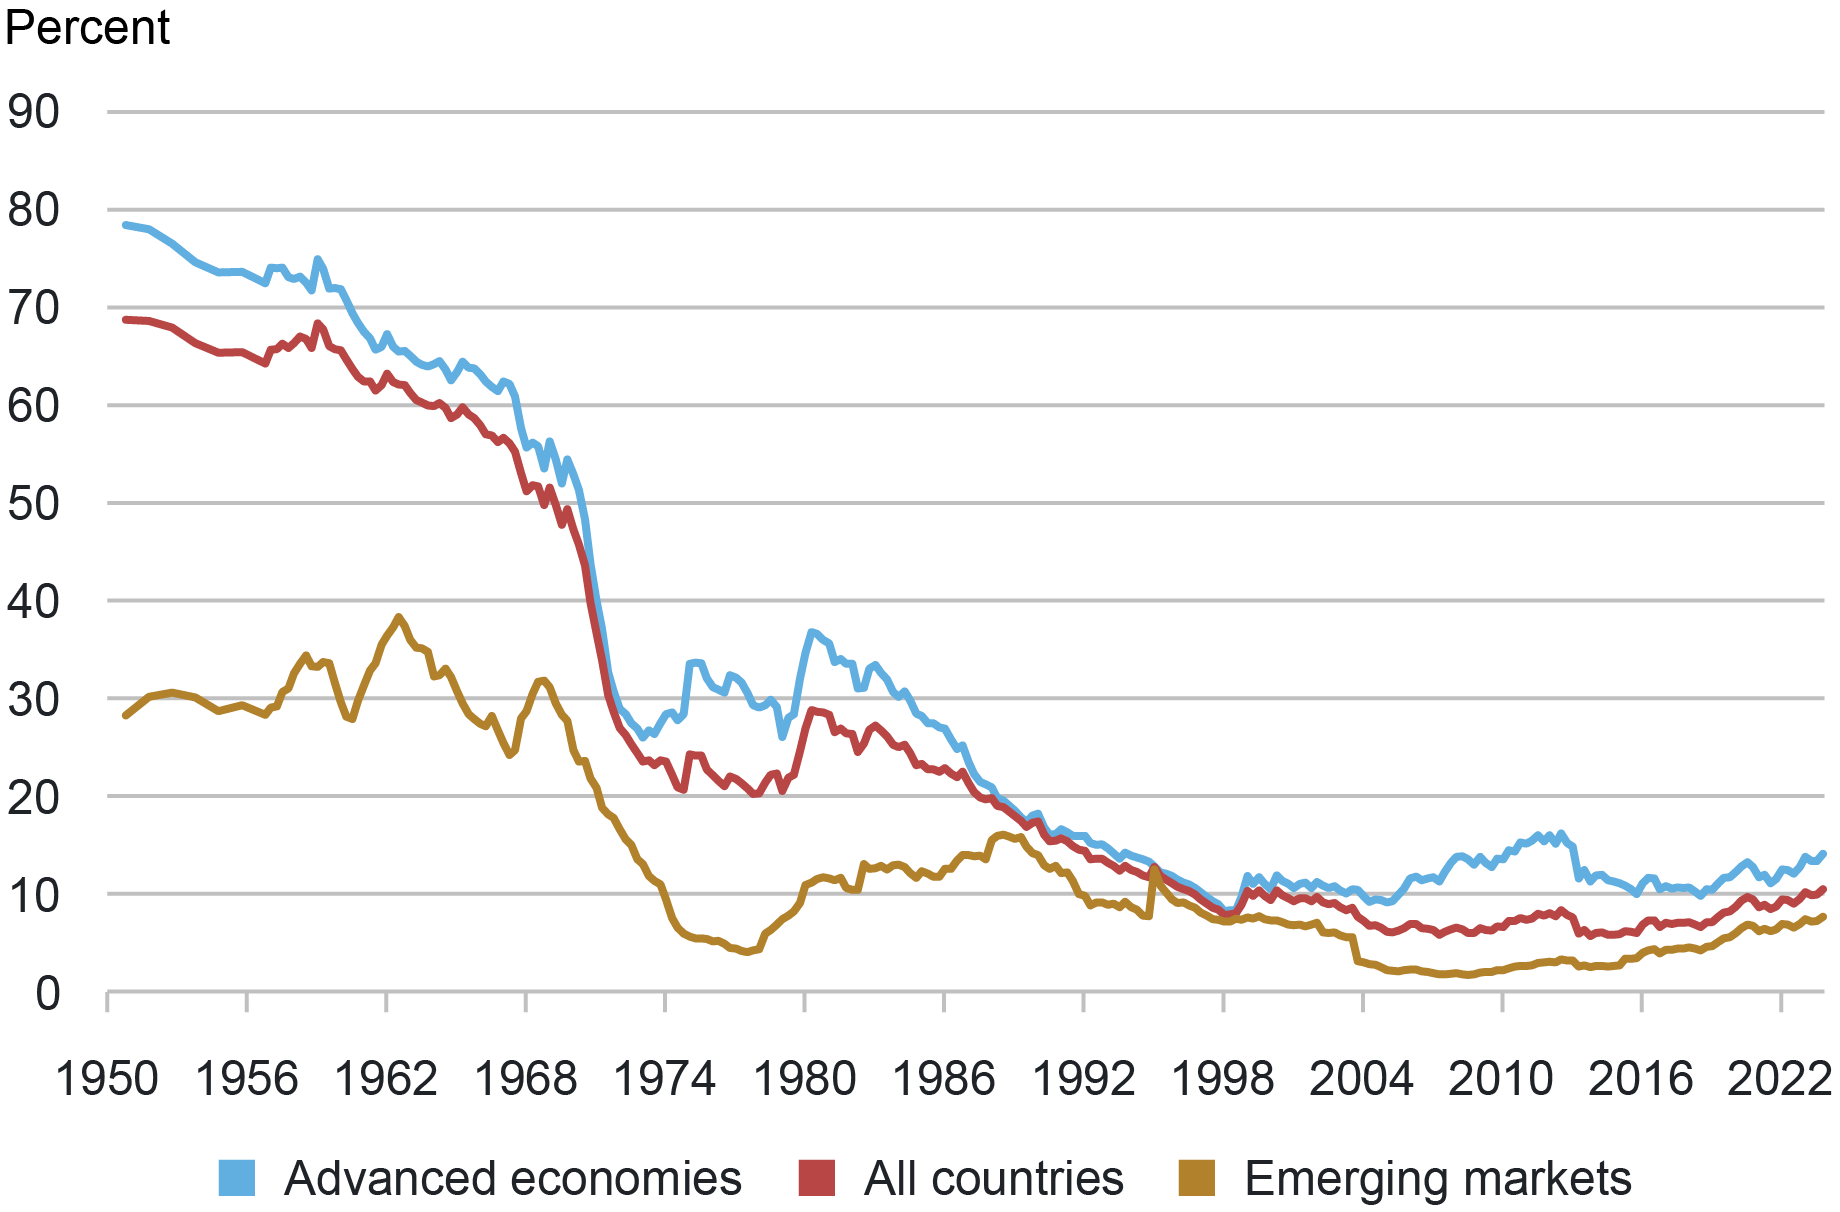
Note: Gold shares are calculated based on national valuation of gold.
Conclusion
Overall, our research suggests that the narratives about declining dollar shares in official reserves, and increasing roles for gold holdings by central banks, inappropriately generalize the actions of a small group of countries. The decline in the dollar share of reserves is not even always about dollar preferences. Our findings add insights to the messages of the ECB’s 2023 report on the International Role of the Euro, wherein a careful survey of key announcements of country intent to shift the currency composition of their reserves was not accompanied by material changes in key indicators of international roles of the dollar.

Patrick Douglass is a capital markets trading principal in the Federal Reserve Bank of New York’s Markets Group.

Linda S. Goldberg is a financial research advisor for Financial Intermediation Policy Research in the Federal Reserve Bank of New York’s Research and Statistics Group.

Oliver Z. Hannaoui is a research analyst in the Federal Reserve Bank of New York’s Research and Statistics Group.
How to cite this post:
Patrick Douglass, Linda S. Goldberg, and Oliver Z. Hannaoui, “Taking Stock: Dollar Assets, Gold, and Official Foreign Exchange Reserves,” Federal Reserve Bank of New York Liberty Street Economics, May 29, 2024, https://libertystreeteconomics.newyorkfed.org/2024/05/taking-stock-dollar-assets-gold-and-official-foreign-exchange-reserves/.


Disclaimer
The views expressed in this post are those of the author(s) and do not necessarily reflect the position of the Federal Reserve Bank of New York or the Federal Reserve System. Any errors or omissions are the responsibility of the author(s).
 RSS Feed
 Follow Liberty Street Economics
This is an informative post. The conclusion reached by the authors, however, may miss the point. The move away from dollar reserves in China, Russia, Turkey, and India reflects the larger geopolitical contest for influence between the U.S. and our closest allies and the alternative global regimes represented by some very large, powerful, and increasingly influential nation. To ignore this fact is to bury our heads in the sand. If the trend continues for another decade, the end of the era of dollar predominance will be at hand.