Andrew F. Haughwout, Donghoon Lee, Joelle Scally, and Wilbert van der Klaauw
Today, the New York Fed released the 2013:Q3 Quarterly Report on Household Debt and Credit. The data show the first substantial increase in outstanding balances since 2008, when Americans began reducing their debt. As of September 30, 2013, total consumer indebtedness was $11.28 trillion, up 1.1 percent from its level in the previous quarter, although still considerably below the peak of $12.67 trillion in 2008:Q3. This quarter, the increase was boosted by nearly across-the-board growth. Balances on mortgages, auto loans, student loans, and credit cards all increased. Balances on home equity lines of credit (HELOCs) were the only exception, with a $5 billion decrease. To better convey the implications of these balance changes, this post briefly updates our previous deleveraging analyses.
Delinquency rates overall have been steadily improving since the crisis. Overall 90+ day delinquency rates are at 5.3 percent, much improved from the peak of 8.7 percent reached during 2010:Q1. New foreclosures have finally reached precrisis levels and are now at the lowest levels since 2005, with 168,000 individuals seeing a foreclosure notation added to their credit reports in 2013:Q3.
A Deleveraging Update
This quarter, we’re updating our decomposition of the changes in the aggregate mortgage balance through 2012. We first described the decomposition in balance change in March 2011, and then followed up in a blog post updating the framework through 2011. Here, we switch to quarterly data—tracking the sum of each component’s movements since four quarters earlier—so that more recent movements in the series can be examined.
We previously found that much of the reduction seen at the overall level was due to consumers actively reducing their debt by borrowing less and paying down their existing liabilities, although charge-offs were also contributing to the decrease in aggregate balances.
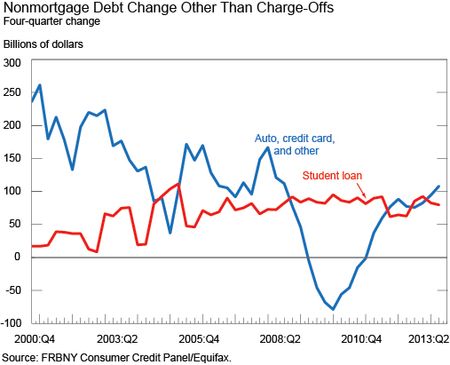
Let’s begin with debt other than mortgages and HELOCs. In the chart below, we show four-quarter changes in the balances on this debt after removing the effects of defaults. Student loan balances—the red line—continue to grow throughout the period. The four-quarter change in the balance on auto, credit card, and “other” debt (blue line) has continued its recovery since last summer, and the net change is now (as of 2013:Q2) back to levels last seen in 2008.
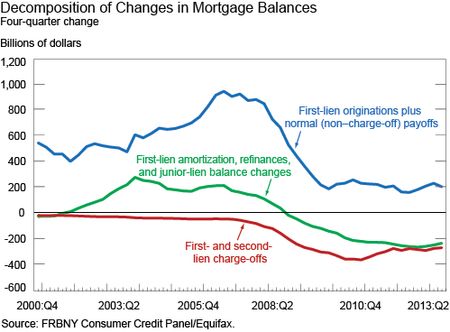
Next, let’s turn to mortgages, with which we include HELOCs. There are three components behind the change in the aggregate mortgage balance, all of which can be seen in the next chart:
- We’ll start with the blue line, which represents changes in balances from normal housing transactions. After a rise and fall, this component has remained low – and relatively steady – in the past few years as home prices remained stagnant through the end of 2012.
- In red, we show the value of charge-offs—the contribution that foreclosures have made to the change in mortgage balances. As the rate of foreclosures slows, the negative contribution of foreclosures has declined, but still exceeds its precrisis level.
- In green, we present the combined effect of cash-out refinances, changes in junior-lien balances, and regular amortizations of first-lien balances. What’s just barely discernible in the chart is that this line turns upward between 2012:Q3 and 2013:Q2, indicating that households actively paid down less of their mortgage balances, on net, than they did previously. This is the first time we’ve seen a sustained reduction in the drag on balances exerted by pay-down.
Rising nonmortgage balances, combined with diminishing effects of mortgage pay-down, suggest that household deleveraging is decelerating. Indeed, when we combine the green line from the mortgage chart with the red and blue lines from the nonmortgage chart, we find that the sum is getting quite close to positive territory. We’ll watch the upcoming data closely for conclusive evidence that household deleveraging is complete.
Disclaimer
The views expressed in this post are those of the authors and do not necessarily reflect the position of the Federal Reserve Bank of New York or the Federal Reserve System. Any errors or omissions are the responsibility of the authors.

Andrew F. Haughwout is a vice president in the Federal Reserve Bank of New York’s Research and Statistics Group.

Donghoon Lee is a senior economist in the Group.

Joelle Scally is a research associate in the Group.

Wilbert van der Klaauw is a senior vice president in the Group.


 RSS Feed
 Follow Liberty Street Economics