Nicola Cetorelli, James J. McAndrews, and James Traina
This post is the sixth in a series of thirteen Liberty Street Economics posts on Large and Complex Banks. For more on this topic, see this special issue of the Economic Policy Review.
In yesterday’s post, our colleagues discussed the historic changes in financial sector size. Here, we tackle a related question on dynamics—how has bank complexity evolved through time? Recently, academics and policymakers have proposed a variety of strong actions to curb bank complexity, stemming from the view that complex banks are undesirable. While the large banks of today are certainly complex, we lack a thorough understanding of how they got that way. In this post and in our related contribution to the Economic Policy Review (EPR) volume, we focus on organizational complexity, measured by the number and types of entities organized together under common ownership and control. Using a new data set of financial-sector acquisitions, we study the structural evolution of banks and its implications for policy. We argue that banks grew into increasingly complex conglomerates in adaptation to a changing financial sector.
Complexity and Financial Acquisitions
In a 2012 series of blog posts, we debated the role of banks in an evolving financial intermediation industry. Fueled by the advent of asset securitization, intermediation was moving “to the shadow,” with nonbank entities increasingly able to fulfill the functions traditionally provided by banks. We argued—and showed some evidence—that one way for banks to adapt was by reorganizing, developing into larger bank holding companies (BHCs) incorporating the nonbank entities that were becoming so important to the process of intermediation. Here, we build on those original thoughts, presenting a deeper analysis of banks’ evolution into complex conglomerates.
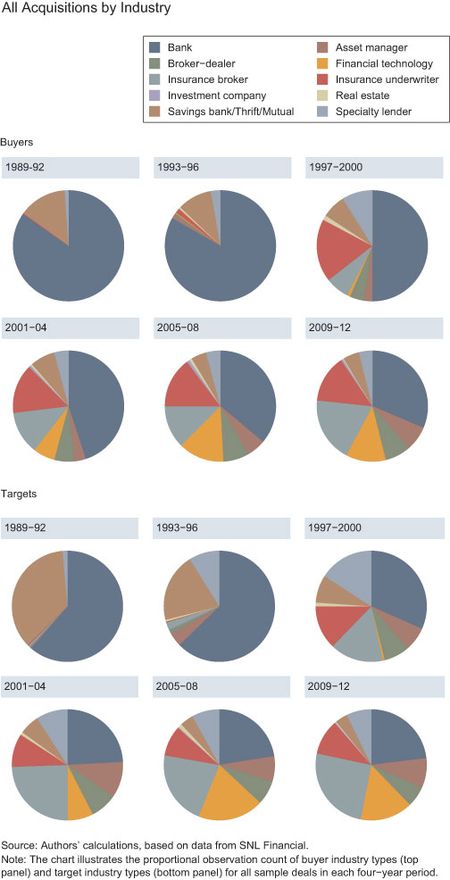
How did this transformation take place? To address this question, we use a comprehensive data set of U.S. financial-sector acquisitions from SNL Financial, focusing on trends in bank structure (and, therefore, bank complexity) by looking at the industry types of buyers and targets. Our deals span 23,451 unique entities across ten different industries from 1989 to 2012. Note that since these are industries, “bank” refers to both commercial banks and bank holding companies.
To get a preliminary sense of trends in structure, consider the buyer and target industry types through time. Who bought whom? As the pie charts below show, although banks and thrifts were the main buyers in the late 1980s (large blue and brown slices), more industry types become involved as buyers over time (more equitable slices). By the second half of the 1990s, all industry types in our sample were buying. The variety in target types also widened gradually over time, with nonbank targets already representing the large majority in the second half of the 1990s (small blue and brown slices). Despite these trends, buyer and target proportions have changed little since the height of the financial crisis.
Cross-Industry Activity
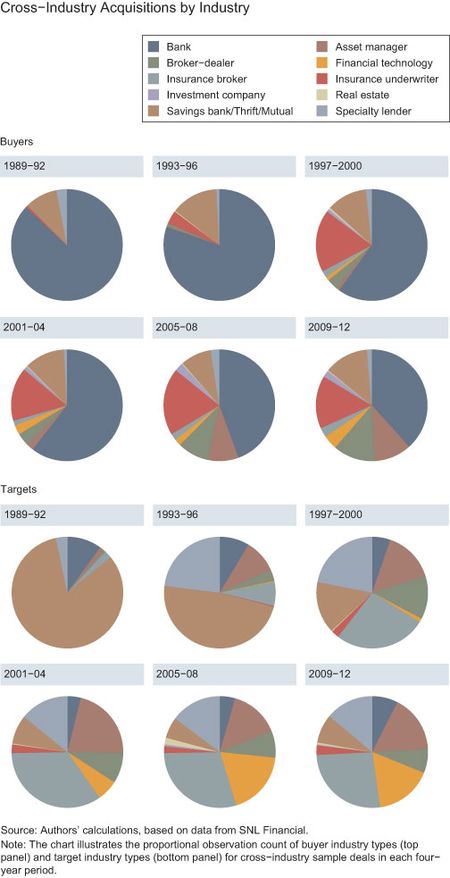
Banks were certainly major players in financial acquisitions, incorporating a large and growing number of subsidiaries into BHC structures. However, we care more specifically about nonbank acquisitions since these deals directly contribute to organizational complexity. The cross-industry activity itself is economically meaningful, comprising about 40 percent of our sample deals over the last thirty years. This fact already hints at a useful context: the banking behemoths of today arose as part of a broad process that has transformed the banking industry more generally.
The charts below show the composition of buyer and target industry types in cross-industry acquisitions through time. Each slice represents the relative observation counts in each four-year period. In these pie charts, we observe that the entire financial sector was reorganizing over time. Banks were buying nonbanks such as specialty lenders, asset managers, and broker-dealers. And so, in the top panel, the big blue chunks illustrate how BHCs grew into increasingly complex conglomerates by gobbling up nonbank intermediaries, whose types are picked up by the colorful variety in the bottom panel. This cross-industry acquisition wasn’t limited to banks; all other financial-entity types were expanding into other industries by the 2000s. What’s more, targets weren’t concentrated in any one industry, suggesting that industry-specific factors didn’t drive the development, nor did a desire to evade regulation explain it, as unregulated sectors were expanding in similar ways.
Two observations jump out: first, banks have become less bank-centric by expanding the types of their subsidiaries, and second, the phenomenon was widespread as even nonbank financial firms expanded their scope. Because it’s so widespread across different types of firms, it’s unlikely that regulatory changes fully explain this evolution—other changes in the underlying technology of financial intermediation seem necessary to explain such widespread and thorough industrial reorganization. Holding company structures apparently offered key advantages in this new environment, collecting nonbank specialists under one organization and internalizing frictions across the intermediaries. In our companion EPR paper, we present other trends that support this interpretation.
Understanding the evolving structure of banks offers insights for the comparative evaluation of policy solutions to bank complexity problems. For instance, blunt fixes such as caps and breakups might fragment the intermediation industry and trade large and complex regulated holding companies for smaller shadow entities outside the scope of oversight. If conglomerate structures are the result of an adaptation to technological advances, then tractable policies, such as enhanced capital requirements, stress tests, and resolution plans, may reduce systemic risk while retaining adaptive synergies. Design of such policies presents a key challenge going forward.
Disclaimer
The views expressed in this post are those of the authors and do not necessarily reflect the position of the Federal Reserve Bank of New York or the Federal Reserve System. Any errors or omissions are the responsibility of the authors.

Nicola Cetorelli is an assistant vice president in the Federal Reserve Bank of New York’s Research and Statistics Group.

James J. McAndrews is the Bank’s director of research.

James Traina is a senior research analyst in the Research and Statistics Group.


 RSS Feed
 Follow Liberty Street Economics
Great charts. I started out of school at SNL Financial and specialized in FIG M&A. It’s a fascinating space because it’s ever-changing. Banks are just defined financial intermediaries. Non-deposit liability creation is a clear trend over the past 20+ years among all institutions, and it would be smart policy to work with it and not attempt to push it only in to the shadows, which is unfortunately a lot of current policy thinking.