This series examines the Federal Reserve Bank of New York’s dynamic stochastic general equilibrium (FRBNY DSGE) model—a structural model used by Bank researchers to understand the workings of the U.S. economy and provide economic forecasts.
The previous post in this series showed how the Federal Reserve Bank of New York’s DSGE model can be used to provide an interpretation of the Great Recession and the slow recovery. In this post, we look at the role of the model as a forecasting tool and evaluate its forecasting performance since 2010. This analysis will give context for the last post, which will present the model’s current forecast for the U.S. economy.
As explained in a previous post, the FRBNY DSGE model is a medium-scale model of the U.S. economy that characterizes the behavior of households, firms, financial intermediaries, and the monetary and fiscal policy authorities. The model is driven by exogenous shocks, which are the source of macroeconomic fluctuations. These shocks are identified by matching the model dynamics with observed data. (This New York Fed staff report has the complete specification of the model.)
In this blog post, we discuss the real-time forecasts from the FRBNY DSGE model starting from March 2010, when we began producing policy forecasts, and provide an assessment of the model’s overall forecasting accuracy. The forecasts have been produced roughly eight times a year, about two weeks before each Federal Open Market Committee (FOMC) meeting, and have all been released in internal documents. Note that the FRBNY DSGE forecast is not the official FRBNY staff forecast and that the specification of the model has evolved over time, reflecting attempts to capture important features of the economy more precisely as well as researchers’ progress in modeling. For instance, in 2011 we introduced financial frictions, which play a crucial role in explaining the Great Recession and shaping the current forecast. In addition, we use market-based observations of the expected future federal funds rate to capture the changing nature of the forward guidance provided by the FOMC.
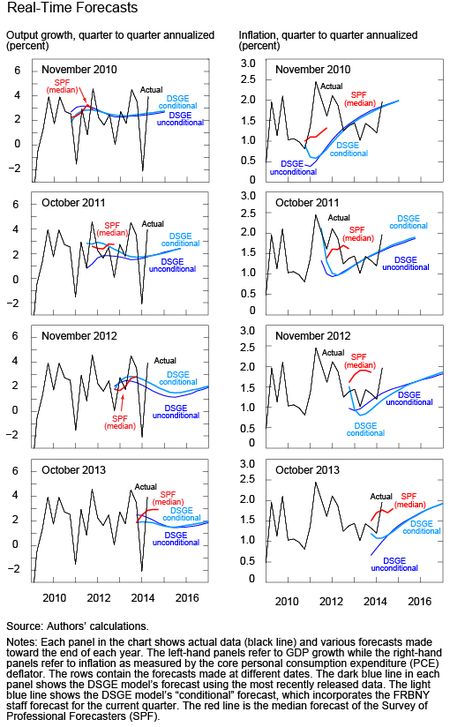
The chart below shows vintages of the DSGE model’s forecasts for quarterly output growth and core inflation (as measured by the PCE, or personal consumption expenditure deflator, at annualized rates), made at the end of 2010, 2011, 2012, and 2013. Each panel shows two types of DSGE forecast. The first, referred to as an “unconditional” forecast (dark blue line), uses the most recently available released data, while the second, termed a “conditional” forecast (light blue line), incorporates the FRBNY staff forecast for the current quarter and treats it as actual data. The red line in each panel represents the median forecast of the Federal Reserve Bank of Philadelphia’s Survey of Professional Forecasters (SPF), reported for comparison. We consider the last forecast vintage generated for each year so that the SPF forecasts have the longest possible forecast horizon. Note that all vintages of SPF forecasts are produced after the DSGE forecast is produced; hence, the DSGE model is at an informational disadvantage relative to these forecasters. However, the conditional DSGE forecast partly overcomes the informational disadvantage (see the discussion in Del Negro and Schorfheide).
The chart shows that while the DSGE model did not capture some of the near-term movements in GDP growth, it has been consistently and accurately forecasting a relatively sluggish recovery. The model under-predicted inflation in 2011 and early 2012 largely because it missed the jump in commodity prices associated with the Arab Spring and its effect on core inflation. We can see, however, that in 2012 and 2013, after the effect of commodity prices waned, inflation fell and is now broadly in line with the DSGE model’s forecast made in 2010.
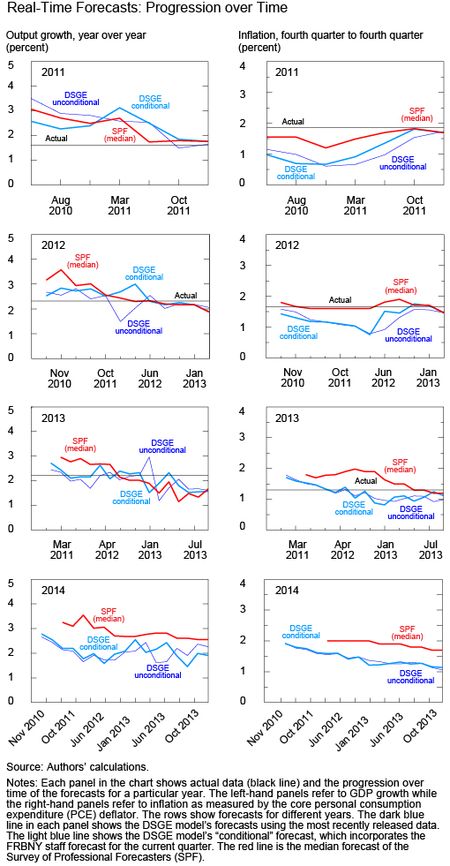
The next chart reports the progression over time (that is, for different vintages) of the forecast for output growth (year over year) and core PCE inflation (fourth quarter to fourth quarter) in 2011, 2012, 2013, and 2014. The lines are color-coded as in the previous chart, and the solid black line indicates the realized value (as reported in the July 2014 GDP release). We show these yearly forecasts because they allow for a comparison with SPF forecasts over longer horizons than do the quarterly forecasts.
In predicting output growth, the model’s forecasts have been comparable to, if not better than, the median SPF forecasts. To some extent, the SPF has been too sanguine about growth, especially in the medium-long term, as professional forecasters have repeatedly anticipated a strong recovery in the aftermath of the financial crisis. Conversely, the DSGE model has been consistently predicting a very slow recovery following the financial shock. As a consequence, for each of the years considered, the SPF produced overly optimistic growth forecasts, which, as time passed and more information was accumulated, declined to where the DSGE model had been all along. (Bear in mind that some of the misses reflect the comprehensive revisions of the national income and product accounts data.)
The model’s forecasts of continued weak growth reflect financial headwinds that have lasted well past the end of the recession. These headwinds stem from the high perceived riskiness of borrowers—a credit friction that disrupts financial intermediation—and the low perceived return on physical investment, as described in more detail in the previous post in this series.
Overall, the DSGE model has historically performed as well as—if not better than—consensus forecasters in predicting macroeconomic trends. Continual refinement of the model specification has helped account for the effects of credit frictions and changes in the perceived risks in the economy as drivers of the Great Recession, enabling the model to predict a slow recovery much earlier than the median SPF forecaster.
Disclaimer
The views expressed in this post are those of the authors and do not necessarily reflect the position of the Federal Reserve Bank of New York or the Federal Reserve System. Any errors or omissions are the responsibility of the authors.
Matthew Cocci is a senior research analyst in the Federal Reserve Bank of New York’s Research and Statistics Group.
Marco Del Negro is an assistant vice president in the Group.
Stefano Eusepi is a research officer in the Group.

Marc Giannoni is an assistant vice president in the Group.
M. Henry Linder is a former research analyst in the Group.
Sara Shahanaghi is a research analyst in the Group.


 RSS Feed
 Follow Liberty Street Economics