In June 2014, settlement fails of U.S. Treasury securities reached their highest level since the implementation of the Treasury fails charge in May 2009, attracting significant attention from market participants. In this post, we review what fails are, why they are of interest, and how they can be measured. In a companion post following this one, we evaluate the particular circumstances of the June 2014 fails.
What Is a Settlement Fail?
A settlement fail occurs when a market participant is unable to make delivery of a security to complete a transaction. Such a “failure to deliver” can result from the outright sale of a security, or the initiation or termination of a transaction to borrow or lend a security. The party to whom the delivery was due will also record a fail, in the form of a “failure to receive.” “Gross fails” refers to the sum of fails to deliver and fails to receive.
What Causes Fails?
Widespread settlement fails in the Treasury market reflect an imbalance between the demand to borrow a security and the available supply of that security. For example, the demand to borrow a security might be high because many investors have chosen to sell the security without owning it, and consequently need to borrow it to make delivery. An imbalance may also result if the available supply of a security is low because few owners are able or willing to lend it. It follows that settlement fails are resolved either by an increase in the available supply of a security, as when the Treasury increases the outstanding amount of a security by “reopening” an issue, or by a reduction in the demand to borrow the security.
Past Episodes of Fails
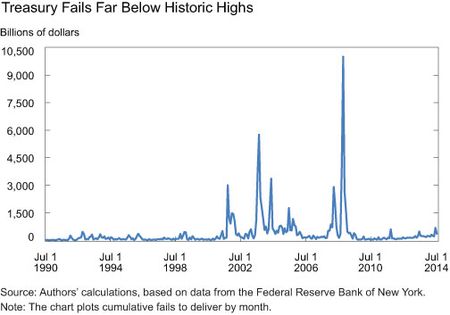
Sporadic and temporary spikes in Treasury settlement fails are not new, with episodes of high fails arising after September 11, in the summer of 2003, and after the failure of Lehman Brothers.
Why Do Fails Matter?
Settlement fails can create liquidity problems for market participants, introduce operational risk, and increase counterparty credit risk because they effectively extend the period before a transaction can be settled. In the extreme, widespread settlement fails can cause market participants to withdraw from the market, adversely affecting market liquidity and potentially raising the U.S. government’s borrowing costs.
Introduction of Fails Charge
In May 2009, the Treasury Market Practices Group (TMPG) introduced a fails charge for the Treasury market, which increased the cost of failing. Since that time, the incidence of fails has decreased considerably. Indeed, the fact that fails spiked in June, despite the charge, is an important reason why the episode attracted attention.
Measuring Fails with FR 2004 Data
One source of data on settlement fails is the Federal Reserve. As described here, the Fed reports, on a weekly basis, cumulative settlement fails to receive and fails to deliver in U.S. Treasury and other securities. (The cumulative nature of the reporting means that a fail gets reported for each day it remains outstanding.) The data only reflect fails involving primary dealers, which report the data to the Fed (via the FR 2004 statistical releases), and for the most part are reported in aggregate (that is, for all Treasury securities as a group). These particular data series are available back to 1990 (2001 for corporate securities).
As shown in the chart below, fails to deliver are not unusual; they occur in every week in our 1990-2014 sample (the pattern of fails to receive looks similar). Fails are also quite volatile, with cumulative monthly delivery fails peaking in October 2008 at just under $10 trillion. Another notable pattern is the markedly lower level of fails since implementation of the fails charge in May 2009. Moreover, while the scale of the chart makes it difficult to discern, fails in June 2014 rose to their highest monthly level since December 2008.
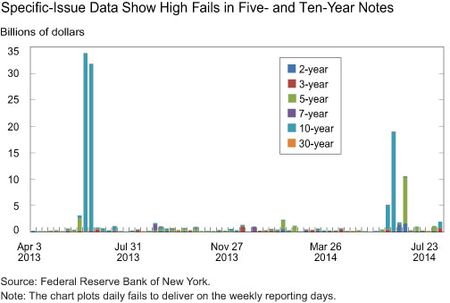
In addition to compiling data on fails aggregated by security type, the Fed collects and releases data on settlement fails in certain specific issues, as described in this Liberty Street Economics post. The particular securities covered are the most recently issued (that is, “on-the-run” or “benchmark”) Treasury notes and bonds of a given maturity. In contrast to the aggregate data, the specific-issue fails data are reported as of the reporting date rather than cumulatively for the reporting week. Such data have been released by the Fed since April 2013.
The chart below plots the specific-issue fails to deliver for the nominal (or fixed principal) Treasury securities; data for Treasury inflation-protected securities (TIPS) are also reported. Note the high fails on reporting days in June 2014 for the five- and ten-year notes. Also, while the plotted history of such data is fairly short, fails in the ten-year note on reporting days for June 2013 were high as well. As we explain in the subsequent post, fails in issues other than the benchmark issues also help explain the high overall level of fails in June 2014.
Measuring Fails with DTCC data
A second source of data on settlement fails is the Depository Trust and Clearing Corporation (DTCC). DTCC publishes fails data from its government securities division every business day, reflecting netted transactions in both agency and Treasury securities. The data reflect fails among DTCC netting members and thus capture a larger universe of entities than the FR 2004. Like the FR 2004, the data are aggregated by security type. Moreover, DTCC fails data are published on a gross basis, so that the published “total” fails data aggregate fails to deliver and fails to receive, and thus double-count failed transactions. Fails data for the most recent year are available from DTCC’s website.
The broader universe of reporting entities—as well as the daily reporting frequency—gives the DTCC data value beyond the FR 2004 data. At the same time, the broader universe of entities captured—when combined with the gross nature of the fails reporting—means that some transactions that are failing to settle get quadruple-counted. In particular, if a $100 million trade is executed through an interdealer broker that is a netting member, then the settlement chain might increase reported total fails to $400 million ($100 million fail-to-deliver for Dealer A, $100 million fail-to-receive for the inter-dealer broker, $100 million fail-to-deliver for the inter-dealer broker, and $100 million fail-to-receive for Dealer B). In contrast, if the interdealer broker is not part of the fails chain, then the reported total fails would be $200 million. The relationship between the dollar volume of a transaction underlying a fail and the resulting volume of DTCC “total fails” thus depends on the netting members involved (and participant-level fails data are not available to adjust the data).
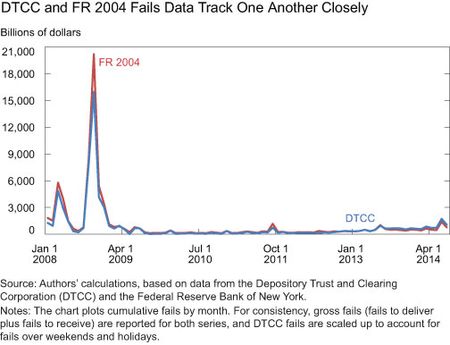
As shown below, fails data from DTCC exhibit many of the same patterns as the FR 2004 data. That is, fails are not uncommon, are quite volatile (peaking in October 2008 at almost $16 trillion), and have been markedly lower since the fails charge took effect in May 2009. Moreover, fails in June 2014 rose to their highest level since December 2008.
The chart above also shows that, despite differences in how the data are collected and tabulated, the FR 2004 and DTCC fails data track one another closely. This suggests that the DTCC data provide a good gauge of the FR 2004 series on a timelier and higher-frequency basis, although there is uncertainty about the degree to which some fails are counted multiple times in DTCC’s published data. (The DTCC data are published each morning and reflect the prior day’s total fails, whereas the FR 2004 data are released weekly, eight days after the reporting week.) Daily publication of the DTCC data thus improves transparency of Treasury market functioning.
What’s Next?
We motivated this post by noting that fails in June reached their highest level in more than five years. Now that we have reviewed what fails are, why the high level of fails is of interest, and what data are available to measure fails, we are ready to dig into the data. In particular, by examining the data, we are able to discern how fails evolved over the month of June in several key benchmark issues and to measure fails in seasoned Treasury securities (that is, securities issued some time ago). As we show in the subsequent post, fails in both types of issues figure importantly in the high level of fails in June.
Disclaimer
The views expressed in this post are those of the authors and do not necessarily reflect the position of the Federal Reserve Bank of New York or the Federal Reserve System. Any errors or omissions are the responsibility of the authors.

Michael F. Fleming is a vice president in the Federal Reserve Bank of New York’s Research and Statistics Group.

Frank M. Keane is an assistant vice president in the Bank’s Markets Group.

Antoine Martin is a vice president in the Bank’s Research and Statistics Group.


 RSS Feed
 Follow Liberty Street Economics
The Fed has collected data on agency mortgage-backed securities since July 1990 and has released aggregated data to the public since March 2004 (see “Explaining Settlement Fails” in our Current Issues series, which is available at http://www.newyorkfed.org/research/current_issues/ci11-9.html). Data from January 1998 are available from the New York Fed’s website (http://www.newyorkfed.org/markets/statrel.html). The history of agency MBS fails through 2011 is plotted in this Liberty Street Economics blog post, “Failure Is No Longer a (Free) Option for Agency Debt and Mortgage-Backed Securities” (available at: http://libertystreeteconomics.newyorkfed.org/2012/03/failure-is-no-longer-a-free-option-for-agency-debt-and-mortgage-backed-securities.html.
Thank you, What is the history and statistics for Settlement Fails in Mortgage Backed Securities (MBS) market? Glenn Hautly
Thank you for your question. The DTCC makes fails data publicly available for the most recent year (see http://www.dtcc.com/charts/daily-total-us-treasury-trade-fails.aspx). The New York Fed has access to a longer time series for market monitoring purposes, which is what we use in the post.
Where can I find DTCC fails data beyond 1yr old?