The New York Fed released the Quarterly Report on Household Debt and Credit for the third quarter of 2014 today. Balances continued to rise slightly, with an overall increase of $78 billion. The aggregate household debt balance now stands at $11.71 trillion, up 0.7 percent from the previous quarter, but still well below the peak of $12.68 trillion in the third quarter of 2008.
The report shows increases in all types of credit, except for home equity line of credit (HELOC) balances. Overall, it looks as if the trend of increasing household debt balances is continuing, and in this post, we further investigate the winding down of deleveraging.
Deleveraging Update
We’ve developed a framework decomposing the change in aggregate balances (first described in March 2011), where we found that the reduction in overall debt was due, in large part, to consumers borrowing less and actively paying down their existing liabilities, although we did find that charge-offs were also a major contributor to the decrease in aggregate balances. In a blog post updating the framework in November 2013, we wrote that “deleveraging is decelerating,” as the cash flow from borrowing approached positive territory. Today, we update the framework again.
Mortgage Balances
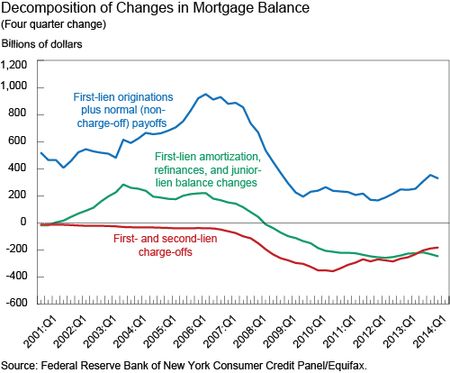
We’ll first break down the change in housing-related balances, including mortgages and HELOCs. The chart below is one that we’ve presented in each of our earlier posts, with data through the second quarter of 2014.
- The red line shows that charge-offs from both first-lien and junior-lien mortgage balances have slowed, as the rate of new foreclosures has declined and the outstanding backlog is worked through. However, charge-offs are still considerably higher than before the recession and continue to reduce debt balances.
- The blue line represents the changes in balances from housing transactions. This line has remained roughly flat, reflecting that the volume of home sales has been sluggish and overall home prices are still below their pre-recession peak.
- The green line measures net paydowns of mortgages: the combination of cash-out refinances, changes in junior-lien balances, and regular amortizations of first-lien balances. We have seen a continuation of the trend that we reported on last year—a steady net paydown of mortgage balances.
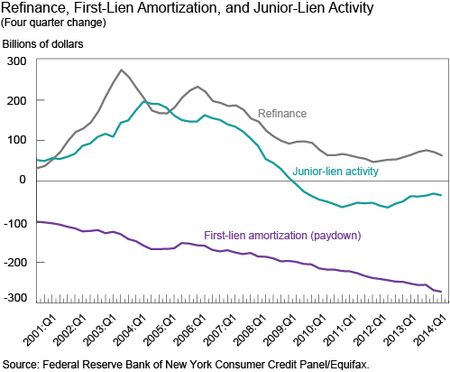
We break this green line into three components in the next chart. In purple, we show the amortization (scheduled pay-downs) of first-lien mortgages. This line is necessarily negative (as payments reduce the balance), and the increases in magnitude over time reflect a faster paydown of balances, which could be attributable to a combination of lower interest rates and shorter remaining maturities on outstanding mortgages. The gray line depicts refinanced mortgages. On net, refinances involve some kind of “cash out,” which we see as a small positive contribution to the overall change in mortgage balances. However, the years before the crisis saw a significantly higher flow of cash-out refinances, which was a major contributor to the increase in the overall mortgage balance.
Finally, the turquoise line illustrates junior-lien balance activity, such as home equity loans and home equity lines of credit. While junior liens were a major source of equity extraction for homeowners during the boom years, we see that the cash flow from junior liens has become negative, reflecting that borrowers are paying down their junior-lien balances.
Nonhousing Debt
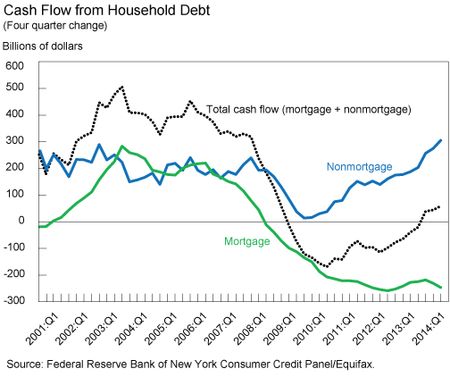
Finally, we consider the decomposition of the balance of nonhousing debt. In the chart below, the green line (again) shows net paydowns of mortgages, while the blue line shows the annual change in the balances of nonmortgage debt after removing the effects of defaults. The annual change in the balances of auto, credit card, and student loans has continued its recovery and is now above its pre-crisis levels.
Total cash flow from mortgage debt and nonmortgage debt combined (black dotted line) has turned slightly positive during the past four quarters, ending a five-year period of negative values, suggesting that, by this measure, the deleveraging process has ended; households have begun to use credit to supplement their cash flow again.
Disclaimer
The views expressed in this post are those of the authors and do not necessarily reflect the position of the Federal Reserve Bank of New York or the Federal Reserve System. Any errors or omissions are the responsibility of the authors.
 Andrew F. Haughwout is a vice president in the Federal Reserve Bank of New York’s Research and Statistics Group.
 Donghoon Lee is a senior economist in the Bank’s Research and Statistics Group.
 Joelle Scally is the administrator of the Center for Microeconomic Data in the Bank’s Research and Statistics Group.
 Wilbert van der Klaauw is a senior vice president in the Bank’s Research and Statistics Group.


 RSS Feed
 Follow Liberty Street Economics
It would be interesting to see how much of the mortgage debt decline could be attributed to the rising share of amortizing mortgages.
Will you be updating your charge off data?