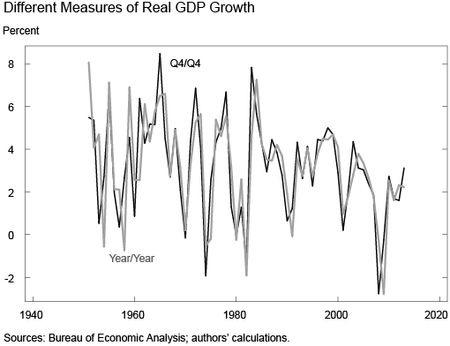
The growth rate in real gross domestic product (GDP) is a conventional indicator of the economy’s health. But the two ways of measuring annual GDP growth can give very different answers. In 2013, GDP grew 2.2 percent on a year-over-year basis, but at a faster 3.1 percent rate on a Q4-over-Q4 basis. So, which measure is more meaningful? We show in this post that the Q4/Q4 metric is better since it only considers quarterly growth rates during the current year, while the Year/Year measure depends on quarterly growth rates in both the current and previous year and puts considerable weight on growth around the turn of the year.
A standard method for reporting annual growth in economic variables (as used by the Bureau of Economic Analysis) is to take the average level for the whole year and compare that with the average level in the previous year, which in our example would be 2012. This calculation results in the Year/Year growth rate:
The alternative measure of annual growth is to calculate Q4/Q4 growth:
The Q4/Q4 measure is, for example, used by the Federal Reserve presidents and Board members in their economic projections. These two measures can give very different values for annual growth rates. The chart below shows them both from 1950 through 2013.
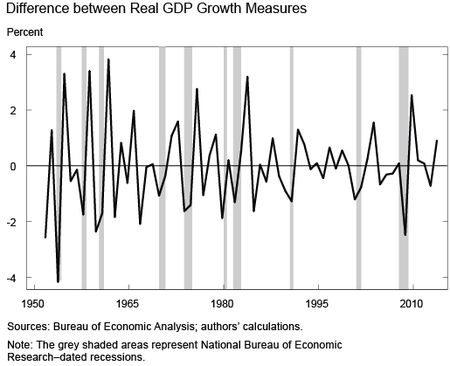
The next chart shows that the difference in the two measures has been over 4.0 percentage points at times, with the standard deviation of the difference being a fairly high 1.7 percentage points. The key insight from the illustration is that the difference between the two measures tends to be extreme right before and right after National Bureau of Economic Research-dated recessions, represented by the grey shaded areas.
So, which of these two measures should one consider? In order to understand the differences between them, we show that each annual series can be approximately expressed as a weighted average of quarterly growth rates. The quarterly growth rate (at an annual rate) is defined as:
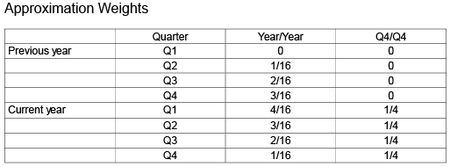
A simple linear approximation to the Q4/Q4 and Year/Year growth rates can be characterized by these weighted averages. The table below shows the weights applied to the respective quarterly growth rates and provides a handy rule of thumb to (approximately) map quarterly growth rates into the two annual growth measures.
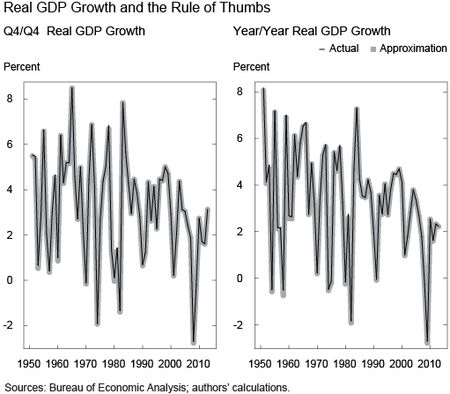
Although these weighted averages of the quarterly growth rates are not exactly the same as the true annual series, they are very close, as shown in the next two graphs. (Yes, there are two lines plotted in each graph!)
The weights in the table provide the intuition for the differences between the two annual series. The Q4/Q4 measure is approximately just an average of the four quarterly growth rates in a given year. Meanwhile, the Year/Year annual measure is a weighted average of the previous and current year’s quarterly growth rates, with the weights shaped like a tent. In fact, the most weight is placed on growth rates around the turn of the year. This feature is an unappealing one as we should care about all growth rates equally. Moreover, the quarterly growth rates from the previous year affect the Year/Year measure, which explains why it is relatively smoother than Q4/Q4 growth. This difference also explains why the gap in the two measures is particularly pronounced around turning points in the business cycle. The Q4/Q4 measure “picks up” any change in GDP growth faster than the Year/Year growth measure.
Despite the appeal of the Q4/Q4 measure, economic forecasters often report GDP growth in Year/Year terms with the notable exception of the Summary of Economic Projections by the Federal Open Market Committee. But, those looking for an alternative can always approximate the Q4/Q4 measure by simply averaging the quarterly growth rates, as we show in this post.
Disclaimer
The views expressed in this post are those of the authors and do not necessarily reflect the position of the Federal Reserve Bank of New York or the Federal Reserve System. Any errors or omissions are the responsibility of the authors.

Richard K. Crump is an officer in the Federal Reserve Bank of New York’s Research and Statistics Group.

Stefano Eusepi is an officer in the Research and Statistics Group.


 RSS Feed
 Follow Liberty Street Economics
I really enjoyed this- especially the weights table.
Classical example of the #SlutskyEffect
While I agree that Q4/Q4 growth is much more pertinent to understand growth dynamic we have to back to the basics to understand. By definition GDP is the flow of production over one year not one quarter. Quarterly GDP data is a sophisticated way to decompose annual data into infra-annual fluctuation using a mix of real data, surveys and models. Year/Year growth rate are the good choice with this annual basis logic. BEA could change the GDP time period from one year to one quarter. Then, Q4/Q4 growth would be an correct measure of GDP growth.