The New York Fed has released a new product—the Household Debt and Credit Report for the Second District—which tracks consumer credit conditions in the tri-state area. Our readers are already familiar with our Quarterly Report on Household Debt and Credit, which primarily tracks credit measures—including balances, delinquencies, and new originations—aggregated to the national level. This report will provide a detailed examination of borrowing and repayment behavior on an ongoing basis for New York, New Jersey, and Connecticut, and each of the five boroughs of New York City. It is based on the New York Fed’s Consumer Credit Panel (CCP), a 5 percent representative sample of credit reports from Equifax. In this post, we highlight selected findings from these new regional profiles.
What types of debt do people have?
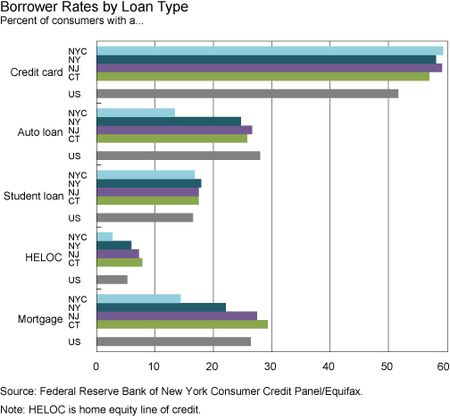
The chart below shows the share of consumers who hold each credit product. As we might expect, mortgage and auto loan borrowing rates are much lower in New York City compared to the region and the United States. The most common credit products among consumers are credit cards, both nationally and in the region.
How much do people owe?
On average, borrowers in New York, New Jersey, and Connecticut have larger balances than what we see in the United States overall. The average per capita balances in 2014:Q2 were $58,200 and $57,800 in Connecticut and New Jersey respectively, considerably higher than the U.S. average of $45,500. New York State is closer to the national average at $47,700. It’s important to note that since mortgages are the largest component of household debt, these averages are affected by the relatively higher price of housing in the Northeast. However, all four regions’ trends depict a similarly timed peak in household debt around 2008:Q3, and all regions’ debt balances still remain below that peak.
How distressed are consumers?
We also present a new measure of credit distress to assess what share of consumers overall are having trouble paying off their debts. Existing measures of distressed consumer debt, including those found in the Quarterly Report on Household Debt and Credit, tend to focus on the share of the outstanding loan balance that is delinquent. Here, we focus instead on the share of people who are delinquent. This distinction is an important one, because even small amounts of delinquent debt can negatively affect a borrower’s credit score and ability to access credit. Our measure of “overall consumer distress” is defined as the share of consumers who are seriously delinquent (ninety or more days late) on some debt or have had a third-party collections balance in the past year. Nationally, 20.4 percent of consumers are classified as distressed. Rates of distress are lower in the Second District, ranging from 15.0 percent in Connecticut to 16.0 percent in New York City.
Variation within New York City
When we drill down to smaller areas within the region, we find that credit conditions vary widely. In addition to state-level and New York City profiles, we’re breaking out data for the five boroughs of New York City, linked at the bottom of this post. The borough profiles highlight considerable heterogeneity within New York City. Unsurprisingly, Manhattanites are far less likely to have a mortgage or auto loan than Americans overall, while residents of Staten Island are near the U.S. average.
Perhaps the most interesting variation is in our overall measure of consumer distress. Only 11 percent of Manhattanites have a serious delinquency or a third-party collections balance in the last year—much lower than the 20 percent national average. The rate is much higher in the Bronx, at 23.5 percent.

The Household Debt and Credit Report for the Second District will be updated twice a year. The report aims to help community groups, state and local governments, and the public to better understand, monitor, and respond to trends in indebtedness and repayment behavior at the borrower level. The links below will take you to the individual reports.
Connecticut
New Jersey
New York
New York City
Bronx
Brooklyn
Manhattan
Queens
Staten Island
Disclaimer
The views expressed in this post are those of the authors and do not necessarily reflect the position of the Federal Reserve Bank of New York or the Federal Reserve System. Any errors or omissions are the responsibility of the authors.
Michael Gedal is a director in the Federal Reserve Bank of New York’s Communications and Outreach Group.
Stephanie Rosoff is an associate director of community development in the Bank’s Communications and Outreach Group.
Joelle Scally is the administrator of the Center for Microeconomic Data in the Bank’s Research and Statistics Group.


 RSS Feed
 Follow Liberty Street Economics
The disparity of consumer distress rates between the boroughs would seem to provide further evidence of income inequality in New York City: 23.5% in the Bronx and 11% in Manhattan. This measure is very interesting and I hope to see you expand its use to the national data, as well.