Banks play a crucial role in the economy by channeling funds from savers to borrowers. The ability of banks to accomplish this intermediation has become an important element in understanding the causes and consequences of business cycles. In a recent staff report, I investigate how a positive deposit windfall translates into investments by banks. This post, the first of two, shows how the development of new energy resources has led to deposit inflows to banks and how that can be used to estimate banks’ investment decisions over the recent business cycle. The second post will look at factors that might explain the business cycle patterns observed below.
“Fracking” Money
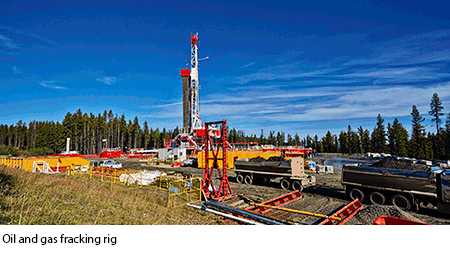
Over the last decade, the use of unconventional methods like horizontal drilling and hydraulic fracturing (“fracking”) have dramatically increased recoverable domestic oil and gas resources. The dollar value of potential production is significant. In 2011, the Energy Information Administration estimated that major shale formations contained $3.5 trillion dollars of gas at prevailing prices. Similarly, the U.S. Geological Survey has estimated that the Bakken shale alone contains over $250 billion dollars of oil. However, in order to extract these resources drillers must first lease mineral rights from local landowners. Typically, these leases pay landowners 10 to 25 percent of the production from the well, so the lease payments from these formations could exceed $750 billion.
But what does this have to do with banks?
As these resources are developed, a portion of these payments wind up in local bank branches as landowners need to store their newfound wealth. These deposit inflows provide us with a “natural experiment,” as funds find their way into banks that are not otherwise seeking additional financing. I can then observe how banks adjust their balance sheets in response to these incremental funds.
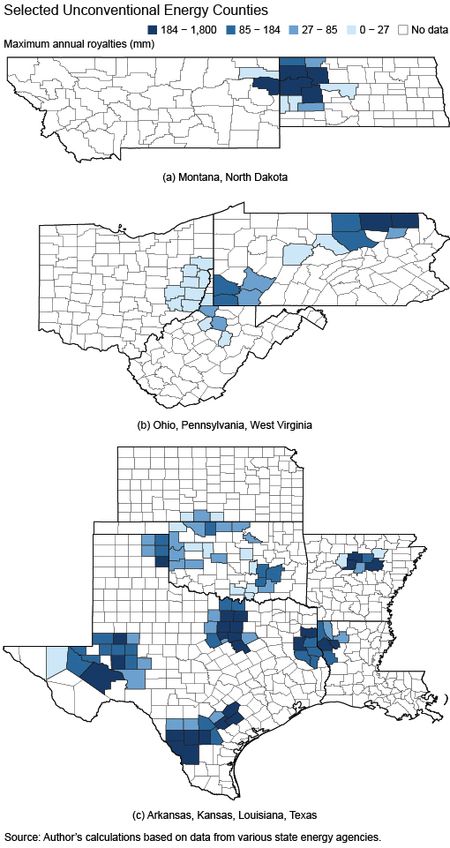
As a first step, I use drilling and production data from ten states to estimate the royalties paid to landowners. Based on these royalty payments, I identify 126 counties that are exposed to significant unconventional energy development. The darker gradations below highlight those counties with the highest potential royalty payments. Details of this procedure can be found in an associated data primer.
In order to understand the relative importance of these payments, I compare them with the deposits held in the county. The payments made in these counties are quite significant relative to the deposit base, with estimated payments averaging 40 percent of the deposits held in the county. Even if a small fraction of these payments end up in banks, they can have a meaningful impact on deposits.
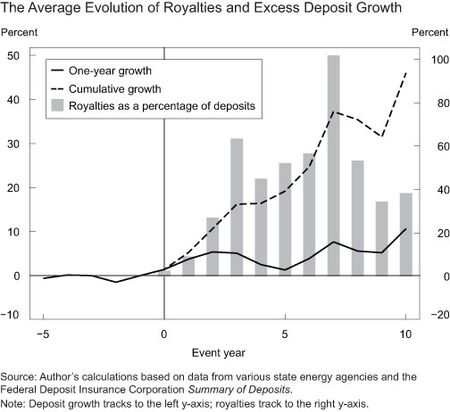
The chart below illustrates the average changes in payments and deposit growth as the energy development ramps up. Year 0 indicates the first year of drilling. County-level deposit growth is calculated as the excess growth rate relative to the surrounding counties. Prior to development, excess deposit growth is approximately zero, but once development begins excess deposit growth is consistently positive. The cumulative effect of this excess growth is particularly dramatic, with deposit levels on average 40 percent higher seven years into development.
I use this variation in county-level deposit growth to construct bank-level estimates. I find the deposit shock influences 389 banks between 2003 and 2012. On average, banks exposed to energy counties experience 4 percent higher deposit growth than other banks.
What Do Banks Do?
Banks have several ways of allocating the new funds on their balance sheet: they can make loans, invest in liquid assets, like cash or securities, or they can pay down other sources of financing. Over the entire sample, 2003-12, I estimate approximately 25 percent of these deposit inflows are allocated to lending and 75 percent to liquid assets. The detailed procedure can be found in the staff report. These allocations vary significantly over the recent business cycle.
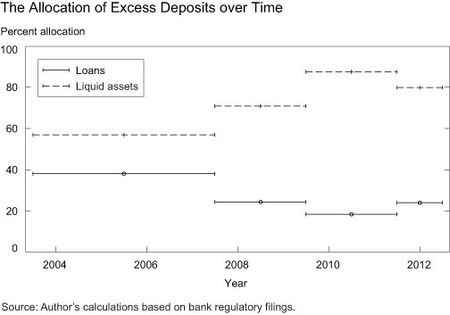
The chart below plots the four time periods in which I estimate how banks allocate the deposit windfall. The line segments indicate the period over which the allocation decisions are estimated, the points reflect the midpoint of the period. The first segment is the pre-recessionary period, the second is the peak of the financial crisis from mid-2007 to mid-2009, the third is the recession from mid-2009 to mid-2011, and the final is mid-2011 to mid-2012. The dashed line is the percentage of the deposit shock allocated to liquid assets and the solid line is the percentage allocated to loans.
Prior to the financial crisis, banks invested 40 percent of the incremental deposits in loans. As the financial crisis ensued, banks choose to invest a greater portion of the deposit inflows in liquid assets, reducing allocations to loans. Allocations to liquid assets peak in the 2009-11 period with roughly 85 percent of the funds being allocated to cash or securities
Clearly, bank behavior changed over the business cycle, with banks less able or less willing to allocate the same percentage of funds to loans as they were prior to the recession. The second post will explore the potential explanations, including declining loan demand by borrowers and increased liquidity demand by banks.
Disclaimer
The views expressed in this post are those of the author and do not necessarily reflect the position of the Federal Reserve Bank of New York or the Federal Reserve System. Any errors or omissions are the responsibility of the author.

Matthew Plosser is an economist in the Federal Reserve Bank of New York’s Research and Statistics Group.


 RSS Feed
 Follow Liberty Street Economics
I’m confused by this post too. It sounds like you’re talking about a reallocation of deposits towards counties with fracking, and asking what the banks in these counties do with that windfall. But you use language that sounds as if you view this as a flow of new deposits into the banking system as a whole (e.g. discussing the behavior of “banks” generally rather than “banks with a deposit windfall”). It would be helpful if you could clarify this point.
What makes you think the deposits will remain in the accounts without being gainfully deployed by the royalty recipients into various productive avenues themselves?