The decline in U.S. GDP of 0.2 percent in the first quarter of 2015 was much larger than market analysts expected, with net exports subtracting a staggering 1.9 percentage points (seasonally adjusted annualized rate). A range of factors is being discussed in policy circles to try to understand what contributed to this decline. Factors such as the strong U.S. dollar and weak foreign demand are usually incorporated in forecasters’ models. However, the effects of unusual events such as extremely cold weather and labor disputes are more difficult to quantify in standard models. In this post, we examine how the labor dispute at the West Coast ports, which began in the middle of 2014, might have affected GDP growth. Although the dispute started as early as July 2014, major disruptions to international trade did not surface until 2015:Q1. By that time, export and import growth through the West Coast ports in the first quarter were 14 percentage points to 20 percentage points lower than growth through other ports.
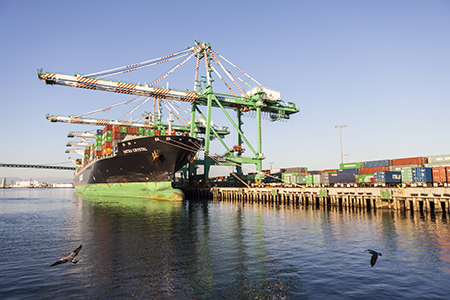
The West Coast dockworkers’ labor contract expired on July 1, 2014. Following months of negotiations, port congestion increased in late October amid allegations of a labor slowdown. The situation reached a boiling point in February as port management largely suspended operations over a long weekend. Finally, on February 20, labor and management reached a tentative agreement, and port congestion started to ease over subsequent weeks.
In order to gauge the effect of the West Coast dispute on U.S. international trade, we examine import and export shipments across various modes of transportation. Goods cross U.S. borders via sea, air, and land (such as trucks crossing Mexico or Canada borders). We label the ports that were directly affected by the dispute as “West Coast ports”; these include all major seaports in California, Oregon, and Washington State. As for the rest of the ports, we label them as “other.”
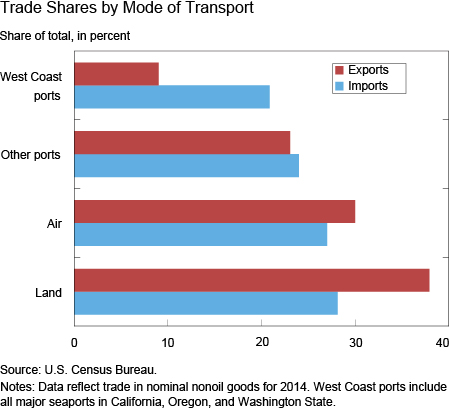
We can start to see the potential impact of the dispute from the chart below, which shows that 20 percent of U.S. nonoil merchandise imports arrive through the West Coast ports and 10 percent of nonoil merchandise exports leave through them. We focus on exports and imports of nominal nonoil merchandise, which account for 8.5 percent and 12 percent of U.S. GDP, respectively.
The dispute had the most bite in the first quarter, with imports and exports through the West Coast ports plunging. From the table below, we see that exports via West Coast ports fell 20.5 percent in Q1, while imports fell 9 percent. These are substantially larger declines relative to previous quarters and bigger declines than in shipments through any other mode of transportation.
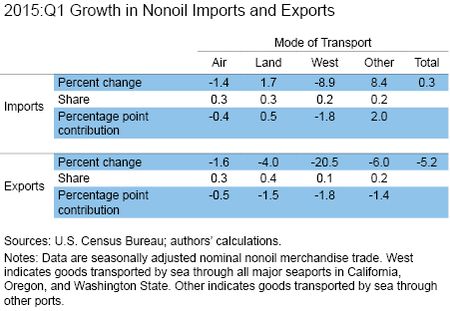
Some trade was likely lost irremediably, such as perishable agricultural exports, whereas other goods were rerouted, came in at a later date, or were sold to domestic consumers. From the table we see that for exports, shipments through West Coast ports were 14 percentage points lower than other ports (the difference between the third and fourth columns). For imports, we see disparities between West Coast and other ports as high as 17 percentage points. Of course, these observed changes could be driven by compositional factors, such as shifts in demand for certain products or other country-specific factors. To check this possibility, we regressed the log change in import (and export) nominal values by transportation mode on a West Coast indicator variable and an interaction of this indicator with a 2015:Q1 indicator to estimate the average growth difference between West Coast ports and other modes of transportation, and to see if the differential widened that quarter. Our analysis controls for detailed product-time effects (for more than 10,000 product categories) and country-year effects. The results from this analysis support the facts reported above. Specifically, we found differential effects for the first quarter between West Coast ports and other ports equivalent to about 20 percentage points. To see whether similar patterns hold for volumes, we reestimated the equations using the physical weight of the shipment rather than the nominal value and we found similar results. After controlling for these additional factors, we find a slightly larger differential between West Coast shipping and other modes of entry. The larger this estimate, the bigger the decline in West Coast shipments and the larger the reallocation of shipments through other ports.
One takeaway from our analysis is that first-quarter import and export growth through West Coast ports were 14 percentage points to 20 percentage points lower than growth through other ports. However, it is not straightforward to calculate the magnitude of the effect of the dispute on aggregate GDP. If all of the decline in real shipments were reallocated to other modes of transportation then the net effect would be zero. A major confounding factor affecting trade during this time is the strong dollar. The appreciation of the dollar reduced the demand for exports and increased the demand for imports. We can see this reflected in the table, with exports relatively weak across all modes of transportation and imports very strong across all modes other than the West Coast ports; for example, seaborne imports through other ports were up 8.4 percent in the first quarter.
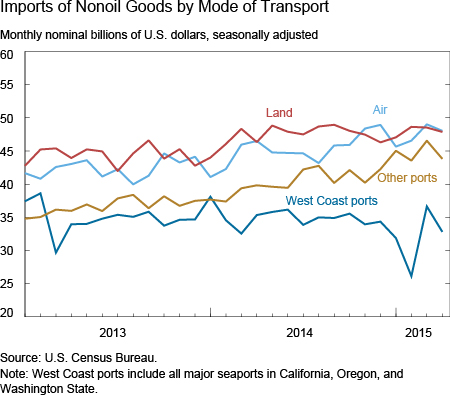
Clearly, lost West Coast exports that were not reallocated to other ports represent a drag on GDP growth. But from a growth accounting point of view, lower import growth actually boosts GDP. However, the data indicate that the West Coast import declines during the dispute were largely compensated by reallocation to other ports and a March import surge when the dispute was officially over (see the next chart). Specifically, nominal imports in March soared, retracing a lot of the decreases posted in January and February. A large portion of the rebound was accounted for by imports from Asian economies (China, Japan, and Asian emerging markets), which most often enter the United States through West Coast ports. In addition, the March surge reflected a particularly strong jump in imports of consumer goods, which tend to be sourced from Asian economies.
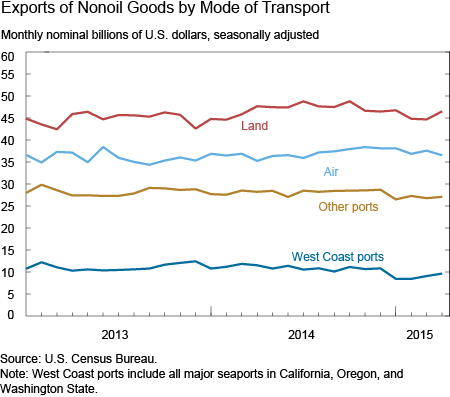
For exports, the evidence supports the view that the port dispute restrained shipments in the first quarter; most of the decline in exports through the West Coast ports does not appear to have been compensated with gains through other transportation modes. One potential explanation for why exports were held down was that supply chain issues restrained output, and thus exports for some industries, as lower availability of imported intermediate inputs led to a delayed adverse effect on production. To calculate the net loss in exports due to the dispute, we work through a counterfactual scenario in which the fall in exports through West Coast ports was commensurate with the average fall in exports through other modes of transportation. Estimates from this scenario suggest that the West Coast port disruption likely reduced real export growth in the first quarter by 1.5 percentage points. In terms of the contribution to net exports to real GDP growth, this would be equivalent to a drag of 0.2 percentage point in the first quarter.
In addition to the net exports channel, the dispute could have impacted GDP through consumer and investment spending. On the positive side, if goods destined for exporting were added to inventories, then this would boost GDP growth. However, if the dispute delayed imports of capital goods and intermediate inputs, this could have led to a loss of manufacturing output and a further loss in U.S. exports. In turn, lower exports lead to reduced output and employment of exporting firms, and lower real activity overall through supply chains. While these indirect effects might be important, they are more difficult to quantify. Our analysis of the direct effects indicates that lower exports subtracted 0.2 percentage point from GDP growth in the first quarter. It is possible that this loss will be made up later in the year, so we will continue to monitor the trade numbers closely.
Note: This post is running in the Federal Reserve Board’s IFDP Notes today also.
Disclaimer
The views expressed in this post are those of the authors and do not necessarily reflect the position of the Federal Reserve Bank of New York, the Federal Reserve Board, or the Federal Reserve System. Any errors or omissions are the responsibility of the authors.
 Mary Amiti is an assistant vice president in the Federal Reserve Bank of New York’s Research and Statistics Group.
Tyler Bodine-Smith is a senior research analyst in the Bank’s Research and Statistics Group.
Michele Cavallo is a senior economist in the Division of International Finance at the Federal Reserve Board.
Logan T. Lewis is an economist in the Division of International Finance at the Federal Reserve Board.


 RSS Feed
 Follow Liberty Street Economics
Yes, you are right. The 0.2 percentage point drag estimate is for 2015:Q1 relative to 2014:Q4 at an annualized rate.
Interesting blog post – thank you. Am I right to assume your 0.2% drag on GDP referred to at the end of the article is on a QoQ annualised basis?