Expectations about the path of interest rates matter for many economic decisions. Three sources for obtaining information about such expectations are available. The first is extrapolation from historical data. The second consists of surveys of expectations. The third are expectations drawn from financial market prices, often referred to as market expectations. The last are usually considered to be model-based expectations, because, generally, a model is needed to reliably extract expectations from current prices. In this post, we explain the need for and usage of term structure models for extracting far in the future interest rate expectations from market rates, which can be used to discount the long run. We will illustrate our arguments by discussing the measurement of long-run discount rates for Social Security.
Long-Run Discounting
While some policy issues involve relatively near-term expectations, others depend on interest rates well into the future. Whenever Social Security collects more total revenue (including interest) than it disburses, the surplus is invested in Treasury bonds in two trust funds, for retirement and disability benefits. When cost surpasses revenues, Social Security draws from those trust funds to meet its obligations. Since the interest accrued in the trust funds matters for the program’s financial health, assessing its future status requires a projection about future bond yields. Both the trustees of Social Security and the Congressional Budget Office regularly project interest rates out seventy-five years as part of their annual evaluations of the financial status of the program. By law, new bonds bought by the Social Security trust funds pay an interest rate that is indexed to the yields on Treasury bonds that have more than four years to maturity. These indexed rates can be approximated by the rate on the ten-year Treasury bond. We explore a model-based approach to inferring market participants’ expectations about future ten-year bond yields using forward rates and also explain the need to adjust for current and future risk premia.
Forward rates, which are calculated from zero-coupon yields, are used by some analysts as measures of expected bond yields. The advantage of forward rates is that they are relatively easy to calculate, are available for multiple maturities over various horizons, and are simple to interpret. For instance, if a three-year bond has a 2 percent yield while a two-year bond has a 1 percent yield, the market implied one-year yield two years in the future, or the two- to three-year forward rate, is 4 percent. In a world with no interest-rate risk, the 4 percent yield exactly equalizes the cash flows between buying a three-year bond and buying a two-year bond and then reinvesting the proceeds from that investment in a one-year bond. Does this mean that the market expects the one-year interest rate in two years to be 4 percent? It would if the pure expectations hypothesis held. That hypothesis says that longer-term interest rates are unbiased forecasts of the path of future short-term interest rates. By contrast, the expectations hypothesis implies that increases (decreases) in longer-term interest rates solely reflect upward (downward) revisions to the expected path of short-term interest rates.
The difference between the two hypotheses is that the former assumes no risk premium, while the latter allows for a constant risk premium over time. When this risk premium, which represents the compensation for the risk that interest rates do not evolve as expected (“interest-rate risk”), is time varying, neither expectations hypothesis holds. This risk premium is generally referred to as the term premium by both academics and practitioners. When term premiums vary over time, it is challenging to disentangle changes in longer-term interest rates from changes in expectations about the future path of short-term rates. As a result, to accurately infer market expectations, one needs to adjust interest rates for term premia.
Does the expectations hypothesis hold?
There is a long, distinguished academic literature testing the expectations hypothesis. Campbell-Shiller present particularly persuasive evidence that market rates are severely biased forecasts of future borrowing costs. We can replicate these results in order to illustrate the failure of the expectations hypothesis. Two convenient ways to state the expectations hypothesis (EH) in terms of zero-coupon bond yields yt(n) , where t refers to the time and n to the remaining maturity of the bond, are:

To test EH (1), we regress the one-period change in bond yields on the yield spread between long- and short-term bonds. To test EH (2), we regress average realized short rates over a period on the spread of long and short maturity bond yields, for which the difference between the two maturities is precisely the horizon covered by the short rates. If the expectations hypothesis holds, both βn and δn should equal one. These tests follow from the expectations hypothesis, because the hypothesis requires that the current yield spread predict changes in long-bond yields over the horizon of the short-bond yield. The estimates, using monthly data from June 1961 to February 2015 for the ten-year maturity, are presented below, based on U.S. Treasury zero-coupon yield data from Gurkaynak, Sack, and Wright.

Contrary to the expectations hypothesis, both coefficients are significantly smaller than one, and the first coefficient is negative. In line with the results of Campbell-Shiller, this result suggests that neither expectations hypothesis holds for bond yields and that looking solely at current market rates to project future rates may generate severely biased forecasts.
Term Structure Modeling
Term structure models address that potential bias by allowing for risk premia that vary over time. Investors require compensation to bear risk. For example, when choosing between a twenty-year bond and a ten-year bond with the plan to purchase another ten-year bond in a decade, investors are uncertain about the interest rate that will prevail in ten years. Conversely, an investor looking to cash out in ten years could choose a ten-year bond or purchase a twenty-year bond with the intention of selling it in ten years. Again, there is uncertainty surrounding the yield on a twenty-year bond ten years in the future. Investors require compensation to bear such risks, including an incomplete awareness of when funds invested in the bond market may be needed for other purposes. The market as a whole comprises many investors with different investment horizons and different perceptions. Interest rates incorporate both expectations and term premia, reflecting the range of views and plans of market participants. To draw inferences when risk premia vary over time, term structure models decompose yields into a risk-adjusted component and a term premium component. Then, the risk-adjusted component can be used to assess market expectations in some average sense. By removing the term premium from the yields, these risk-adjusted components then satisfy the expectations hypothesis, and risk-adjusted longer-term interest rates simply reflect expectations about future shorter-term interest rates. This adjustment is particularly important when term premiums are correlated with yields themselves, as the regressions above suggest.
Term Premium Estimates
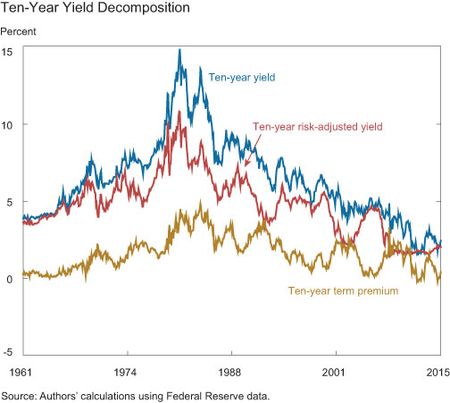
The next plot shows the decomposition of the ten-year yield into the term premium component and the risk-adjusted component using the Adrian, Crump, and Moench model (ACM model).

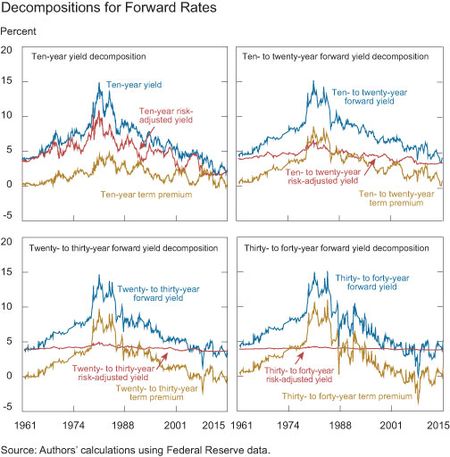
The term premium component tends to be countercyclical while the risk-adjusted component tends to rise in booms (see this post, “Do Treasury Term Premia Rise around Monetary Tightenings?,” for further discussion). For the purposes of discounting future cash flows, the main takeaway is that variation in yields due to term premia is substantial, and that the risk- adjusted yield should be used for discounting. In fact, the farther out in the future one looks, the more important the term premium adjustment becomes. This can be seen in the next plots, which are based on ten- to twenty-year forwards, twenty- to thirty-year forwards, and thirty- to forty-year forwards. (Recall that the ten- to twenty-year yield refers to the ten-year interest rate ten years in the future.) We also redraw the decomposition of the ten-year yield for reference.

In all four forwards, the term premium component is large and strongly co-moves with observed yields. This evidence strengthens the case that the expectations hypothesis fails for market rates due to time-varying risk premia. Note that the risk-adjusted component becomes less variable farther out in the future. The risk-adjusted component for the twenty- to thirty-year and the thirty- to forty-year maturities fluctuate narrowly around the 3.9 percent average value all the way from 1961 to 2015. Similarly, there is a bit more variability for the ten- to twenty-year risk-adjusted forward, which fluctuates between 3.2 percent and 6.6 percent. However, this fluctuation is much more muted than the wide swings in unadjusted yields over this time horizon, ranging from 3.4 percent to 15.2 percent. For comparison, the difference between risk-adjusted yields and market rates can be large, reaching almost 60 basis points for the twenty- to thirty-year forward rates at the end of 2014.
These types of calculations are particularly relevant for very long-run planning, such as for insurance, pensions, and Social Security.Our analysis shows that while forward rates are intuitive forecasts of future bond yields, it is crucial to adjust them to obtain expectations about future interest rates. The risk-adjusted yields obtained using a term structure model such as the one presented above should give a more accurate reading of future bond market conditions. Further, the difference between risk-adjusted yields and their market counterparts is potentially large, thus painting different pictures of the health of the Social Security program in the future, with implications for policy today.
Disclaimer
The views expressed in this post are those of the authors and do not necessarily reflect the position of the Federal Reserve Bank of New York or the Federal Reserve System. Any errors or omissions are the responsibility of the authors.

Tobias Adrian is a senior vice president and the associate director of research for the Federal Reserve Bank of New York.

Richard K. Crump is an assistant vice president in the Bank’s Research and Statistics Group.
Peter A. Diamond is a professor of economics at MIT.

Rui Yu is a senior research analyst in the Bank’s Research and Statistics Group.


 RSS Feed
 Follow Liberty Street Economics
How does one interpret the role of inflation expectations in these models? Does the term premium reflect some (or all) long-term inflation expectations? Does the risk-adjusted series reflect short-term inflation expectations?