The Federal Reserve Bank of New York will begin publishing the overnight bank funding rate (OBFR) sometime in the first few months of 2016. The OBFR will be a broad measure of U.S. dollar funding costs for U.S.-based banks as it will be calculated using both fed funds and Eurodollar transactions, as reported in a new data collection—the FR 2420 Report of Selected Money Market Rates. In a recent post, “The Eurodollar Market in the United States,” we described the Eurodollar activity of U.S.-based banks and compared recent fed funds and Eurodollar rates. Here, we look at the historical relationship between overnight fed funds and Eurodollars and compare the new OBFR rate to the fed funds rate.
The Brokered OBFR
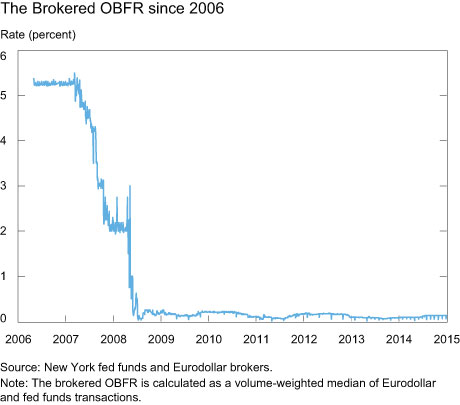
In order to gain insight into how the OBFR might have looked in the past, we use brokered data to construct a “brokered OBFR” dating back to 2006. We use brokered data, instead of FR 2420 data, because the FR 2420 data collection did not begin until 2014. The brokered OBFR is calculated as the daily volume-weighted median of Eurodollar and fed funds transactions; the same calculation will be used for the OBFR when it is published with the FR 2420 data next year. The brokered OBFR is shown in the chart below:

This calculation likely approximates the soon-to-be-published OBFR, although there are some important differences between the two data sets. For example, FR 2420 data include transactions that are not captured in the brokered data—in particular fed funds and Eurodollar transactions negotiated directly between two counterparties. In addition, the Eurodollar information contained in FR 2420 data excludes transactions with non-U.S.-based banks that may be included in the brokered data.
The OBFR and the Fed Funds Rate
The OBFR is intended to complement the effective fed funds rate, so it is useful to see how the two rates would have compared since 2006. For the purpose of this exercise, we compute a volume-weighted median fed funds rate using brokered data, the “brokered fed funds rate.”
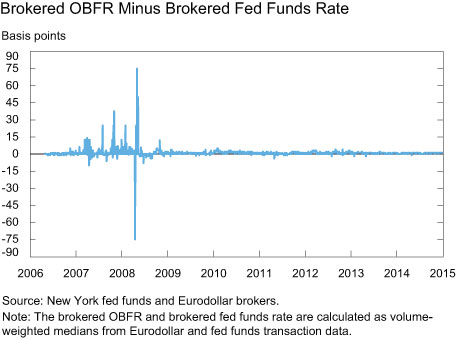
We find that for the majority of the time since 2006, the brokered OBFR traded largely in line with the brokered fed funds rate but diverged, with significant volatility in the spread, amid the throes of the financial crisis. The average spread between the two rates has been only 1 basis point over the nine-year period, as shown in the chart and the table below. However, when market conditions deteriorated, the brokered OBFR rate was on average 2.3 basis points above the brokered fed funds rate, with a maximum spread of 75 basis points. After the crisis, the average spread returned to levels similar to what we observed before the crisis.


Historical Eurodollars and Fed Funds
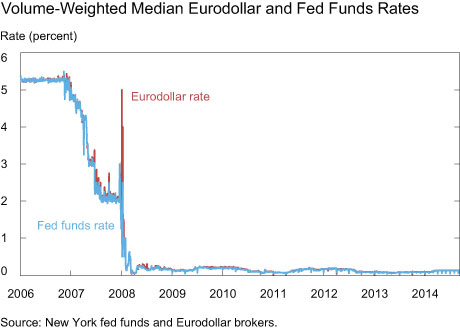
In order to understand the relationship between the brokered OBFR and the brokered fed funds rate, we use brokered data to look more closely at dynamics in the Eurodollar and fed funds markets. U.S.-based banks consider fed funds and Eurodollars to be similar sources of overnight dollar funding. They can borrow fed funds onshore from other banks or from certain other eligible entities, including government-sponsored enterprises (GSEs). U.S.-based banks can also borrow Eurodollars from a broader set of lenders, such as U.S. money market funds. The Federal Reserve imposes a zero reserve requirement on net Eurodollar deposits of U.S.-based banks, effectively treating these deposits the same as fed funds. As a result, under most circumstances institutions borrow fed funds and Eurodollars at similar rates. Since 2006, the average spread between the median rates in each market was 1.9 basis points, as shown in the chart and table below.


Beginning in August 2007, however, the difference between the median Eurodollar and fed funds rates increased as liquidity conditions in U.S. dollar funding markets became strained. Both rates are computed as volume-weighted medians, so their differences were not driven by outlier transactions by a few banks trading at high rates.
For most of the financial crisis, the Eurodollar rate was higher than the fed funds rate, with an average spread of 6.6 basis points. Furthermore, the spread was very volatile. For instance, the Eurodollar-fed funds spread dropped to minus 80 basis points on September 15, 2008, the day Lehman Brothers declared bankruptcy, only to reach a peak of 350 basis points fifteen days later. Indeed, September 2008 was a period of extraordinary volatility, with the difference between the highest and lowest interest rates on fed funds and Eurodollar loans on a given day reaching as high as 900 and 1,200 basis points, respectively.
Eurodollar and fed funds rates diverged during the crisis as the two markets became segmented. Lenders in the fed funds market, mainly GSEs and banks, lent to relatively less risky borrowers, which helped maintain low average rates. Banks perceived to be more risky remained able to borrow in the Eurodollar market at higher rates, generally from money market funds and corporations. In other words, the fed funds market was likely serving borrowers with less credit risk, whereas the Eurodollar market was also catering to borrowers whose credit risk was perceived to be higher. Once liquidity strains subsided, borrowers were able to secure funding at more similar rates and the spread between the two markets markedly declined.
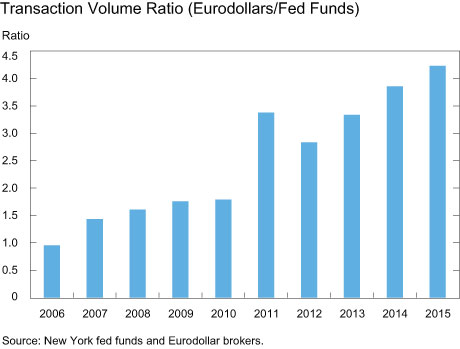
The relative size of the two markets also influences how similar the OBFR is to the fed funds rate. The OBFR is a volume-weighted median of Eurodollar and fed funds transactions, so the impact of each market on the overall rate depends on the dollar volume of Eurodollar and fed funds transactions. As the chart below shows, the ratio of brokered-Eurodollar to fed-funds-dollar volumes has been increasing over time as fed funds volumes have fallen and Eurodollar volumes have risen. As a result of the relative increase in the size of the Eurodollar market, the OBFR, at least in the near term, will have a significantly higher weighting in Eurodollars than it would have had ten years ago.

Conclusions
Once published, the OBFR will provide a new measure of overnight U.S.-based bank funding costs. Since it is based on a larger set of transactions than other existing rates, it will offer market participants a more comprehensive gauge of overnight unsecured borrowing costs for U.S.-based banks. In normal market conditions, the OBFR and the fed funds rate are likely to track each other closely, although differences may emerge in periods of stress.
Disclaimer
The views expressed in this post are those of the authors and do not necessarily reflect the position of the Federal Reserve Bank of New York or the Federal Reserve System. Any errors or omissions are the responsibility of the authors.

Marco Cipriani is a research officer in the Federal Reserve Bank of New York’s Research and Statistics Group.

Julia Gouny is a policy and market analysis manager in the Bank’s Markets Group.

Matthew Kessler is a senior policy and markets analyst in the Bank’s Markets Group.

Adam Spiegel is a senior research analyst in the Bank’s Research and Statistics Group.


 RSS Feed
 Follow Liberty Street Economics
Fed funds and Eurodollar transactions are reported separately by brokers based on the counterparty to the trade and where transactions are booked. Fed funds are borrowings from exempt entities, such as depository institutions or Federal Home Loan Banks, according to Regulation D and are booked in domestic branches. Eurodollar transactions are borrowings from a broader group of lenders, such as money funds, and are booked in IBFs or offshore branches. In the FR 2420 report, which will be used to publish the EFFR and OBFR next year, reporters are required to indicate if transactions are fed funds or Eurodollars according to the report instructions. For Regulation D, see http://www.ecfr.gov/cgi-bin/text-idx?tpl=/ecfrbrowse/Title12/12cfr204_main_02.tpl. For FR 2420 report instructions, see http://www.federalreserve.gov/reportforms/forms/FR_242020151020_i.pdf.
Nice post. I have a basic question though. How do you label any given transaction as a fed fund or Eurodollar? Thanks in advance