


Consumers, financial market participants, and policymakers are particularly interested in the trend, or persistent, component of inflation. But this variable is not observed, which has resulted in a variety of proposed proxy measures. Because each measure has its own strengths and weaknesses, a consensus about a preferred candidate has not emerged. Here, we introduce the Underlying Inflation Gauge (UIG) as a measure of trend inflation. Among its attractive features, the UIG is derived from a large data set that extends beyond price variables and displays greater forecast accuracy than various measures of core inflation.
The persistent component of inflation plays a critical role in many economic and financial decisions. For example, investment and saving choices as well as interest rate determination depend on the expected behavior of inflation over a long-run horizon. Similarly, the underlying trend in inflation plays a critical role in the conduct of monetary policy. Unfortunately, differentiating between persistent and transitory changes in inflation in a timely and reliable manner is a challenge. Consequently, a large research effort has focused on extracting the trend component of inflation from monthly data releases.
Core inflation measures represent the most widely used approach to estimate trend inflation. These measures are designed to remove transitory changes in inflation whose source is either associated with specific items or associated with those items displaying the largest price increases and decreases in a particular month. The former view underlies the “excluding food and energy” inflation measure, while the latter approach is identified with the weighted median and the trimmed mean inflation measures.
Core inflation measures are attractive because they are easy to construct and to understand. There are, however, limitations to core inflation measures. For example, core inflation measures only focus on price components and assume the source of transitory movements in inflation is constant over time. In addition, by excluding components that display large price changes, core inflation measures may remove early signals of a change in trend inflation.
As a complement to core inflation measures and other approaches to estimate trend inflation, we have constructed the UIG. A more extensive discussion of this measure can be found in this Economic Policy Review article, with further details provided by our New York Fed staff report “The FRBNY Staff Underlying Inflation Gauge: UIG.” Here, we highlight several key features of the UIG to help motivate and explain the methodology and model specification used in its derivation. Most importantly, the design of the UIG is based on the premise that movements in trend inflation are accompanied by related changes in the trend behavior of other economic and financial series. Consequently, we examine a large data set to identify the common component of other economic and financial series and then focus on the persistent part of the common component.
To do so, we apply statistical techniques to extract a small number of factors. These factors can be thought of as proxies for the fundamental shocks that drive the common fluctuations in the series and explain a significant amount of their co-movement. The statistical technique—known as a dynamic factor model—provides a very tractable framework to use large information sets, with the extracted factors serving as the basis to construct the UIG. In particular, the UIG is the common persistent component of monthly inflation.
Estimated UIGs for CPI Inflation
We apply our estimation strategy to two data sets. The first data set includes 223 disaggregated price data series in the CPI. The second data set includes the disaggregated price data as well as a wide range of macroeconomic and financial data for a total of 346 series. Importantly, these additional series include variables measured at a monthly frequency, as well as at a weekly and daily frequency. We refer to the first measure as the “prices-only” UIG and the second measure as the “full-data-set” UIG. The UIGs are estimated using data for the period January 1993 through April 2017, with the post-1995 series plotted in the chart below along with the twelve-month change in the CPI.
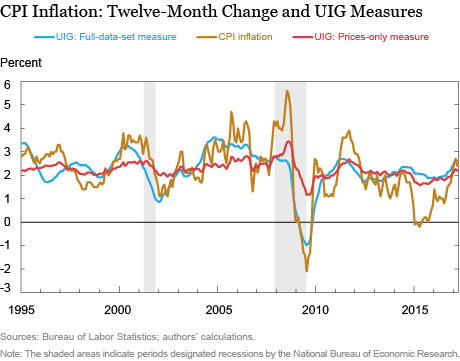
There are several notable features of the UIG measures. First, while the two UIG measures generally track each other, their behavior can display some divergence—especially during recessions. In particular, the full-data-set UIG showed a much more pronounced decline during the 2001 and 2008-10 recessions. These declines presumably reflect the additional information being provided by non-price variables. Second, the full-data-set UIG signaled mounting deflationary risks during the “crisis quarter”—the fourth quarter of 2008—when its value dropped below zero. Last, since 2013 the two UIG series generally have been above actual inflation and were notably so from late 2014 to mid-2016.
The pattern of actual inflation running below the UIG series suggests that transitory factors were exerting downward pressure on inflation. Since mid-2016, however, the gap between inflation and the two UIG measures has narrowed considerably and the three series are now running in close tandem. The most recent reading of the UIGs estimate trend CPI inflation in a 2.2 percent to 2.6 percent range, which is close to the actual twelve-month change in the CPI.
The UIG versus Traditional Core Inflation Measures
While the previous discussion focuses on the behavior and features of the UIGs, it is also useful to provide a comparison of the UIGs to alternative measures of trend inflation. Because of their popularity and widespread use, three core inflation series were selected for comparison: the CPI excluding food and energy prices, the weighted median CPI, and the trimmed mean CPI. The latter two series are produced by the Federal Reserve Bank of Cleveland and their construction is described here. For the comparison, it is important to recall that the main difference between the UIGs and the core inflation measures is that the UIGs add, rather than remove information to signal changes in trend inflation. The chart below depicts the full-data-set UIG along with the twelve-month change in the various core inflation measures.

As shown, the behavior of the three core inflation measures is qualitatively similar. However, the full-data-set UIG often diverges from the core inflation measures, which suggests the UIG is filtering the data in a different way to extract an estimate of trend inflation. In particular, there are extended periods during which movements in the UIG lead those in the core inflation series. This is especially evident during recessions when the UIG signaled notable declines in trend inflation.
We can also use forecast accuracy to compare the UIG measures to the core inflation measures of trend inflation. As detailed in the aforementioned Economic Policy Review article and New York Fed staff report, we analyzed the forecast performance of the various measures at a twelve-month horizon for a sub-period that started before the global financial crisis and a sub-period that included the global financial crisis and its aftermath. We also considered a period that combined both sub-periods. The results show that the UIG measures, especially the full-data-set estimate, display greater forecast accuracy than the various core inflation measures. In particular, forecast errors from the UIG measures are not only lower than those from the core inflation measures, but also indicate that the difference in relative forecast accuracy is both economically and statistically significant. Overall, the UIG measures provide useful information beyond that from traditional core inflation measures and can be used as a meaningful complement when analyzing trend inflation.
Disclaimer
The views expressed in this post are those of the authors and do not necessarily reflect the position of the Federal Reserve Bank of New York or the Federal Reserve System. Any errors or omissions are the responsibility of the authors.
Marlene Amstad is professor of practice in economics at the Chinese University of Hong Kong, Shenzhen, and research fellow at the Federal Reserve Bank of New York.

Simon Potter is an executive vice president and head of the Federal Reserve Bank of New York’s Markets Group.

Robert Rich is an assistant vice president of the Bank’s Research and Statistics Group.
How to cite this blog post:
Marlene Amstad, Simon Potter, and Robert Rich, “Measuring Trend Inflation with the Underlying Inflation Gauge,” Federal Reserve Bank of New York Liberty Street Economics (blog), May 22, 2017, http://libertystreeteconomics.newyorkfed.org/2017/05/measuring-trend-inflation-with-the-underlying-inflation-gauge.html.
 RSS Feed
 Follow Liberty Street Economics
Burton: Thank you for your interest in the post and your comment. We view the monthly movements in inflation as reflecting the sum of three (unobserved) components: an idiosyncratic component, a cyclical component and a trend component. The UIG provides an estimate of the trend component.
To readers inquiring about updates to the UIG: Thank you for your interest in the post. Currently we are not in a position to release the UIG data series. The New York Fed will start providing monthly updates of the UIG charts for the CPI later in 2017.
It would be great if you could add the UIG series to the FRED database.
This is obviously an interesting tool, not least from an investor’s point of view. Do you plan to publish updated UIG estimates? If not, is it possible to somehow get access to the numerical data on the UIG?
Same question as above: will the UIG be updated and publicly available?
Is this UIG report going to be updated on a regular basis by the NY Fed, and how often would be published? In addition, will you publish the historical data in regards to UIG?
Are you able to share the UIG data series? Thank you.
What makes you think that there is an underlying rate of inflation that is different than the actual data? This is not quantum mechanics, where you can indirectly test for the wave function. It’s possible that inflation has become more like the markets, with non-continuities and instantaneous jumps.