The current economic expansion is now the third-longest expansion in U.S. history (based on National Bureau of Economic Research [NBER] dating of U.S. business cycles). Even so, average growth in this expansion—a 2.1 percent annual rate—has been extraordinarily weak. In this post, I return to previous analysis on a specific portion of consumer spending—household discretionary services expenditures—that has displayed unusual weakness in the current expansion (see this post for the definition of discretionary versus nondiscretionary services expenditures, and these posts from 2012 and 2014 for previous updates). Even though these expenditures have picked up over the past couple of years, such that they have finally exceeded their previous peak, their recovery remains well behind that of other major categories of consumer spending. One explanation for the slow growth of spending on discretionary services is that households are concerned about their future income.
Depth of Decline and Extent of Recovery
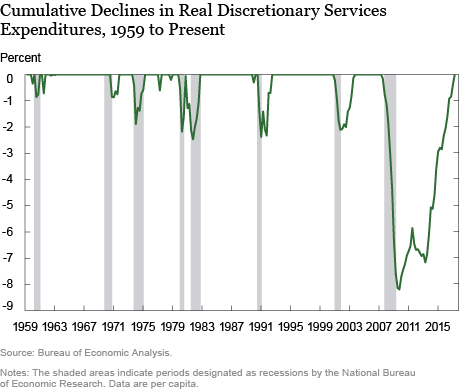
The chart below shows the extent of the decline in real per capita discretionary services expenditures from their previous peak—a zero value in the chart indicates that expenditures are equal to or above their previous peak. From this chart, we see the extraordinary decline of these expenditures—a drop of more than 8 percent at the trough of the Great Recession, compared with a 2 percent decrease in the previous recession. In the first four years of the expansion, progress in recovering from the decline was halting. But since the middle of 2013, recovery has been steadier, with the result that discretionary services expenditures in the second quarter of this year exceeded their previous peak. Unfortunately, it has taken ten years (the previous peak of these expenditures occurred in the second quarter of 2007) to reach this point.

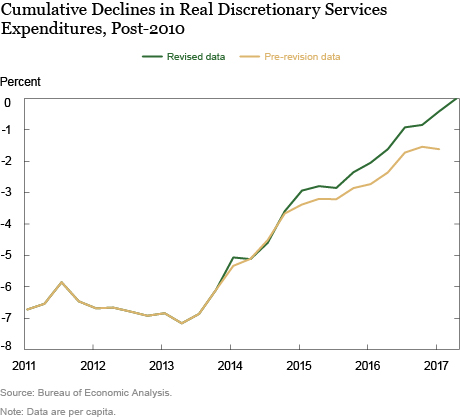
Note that the recovery in discretionary services spending in the past couple of years has been faster than previously thought, according to the Bureau of Economic Analysis’ (BEA) annual revision of the national income accounts, which has upwardly revised those expenditures since the beginning of 2015. The difference can be seen in the following chart, which focuses on the post-2010 period and presents both the latest vintage of the data and the vintage just prior to the annual revision. Much of this revision occurred in transportation services (largely motor vehicle maintenance and repair) and recreation services (see the BEA’s table of major sources of revisions to the national income accounts for details).

Pace of Recovery
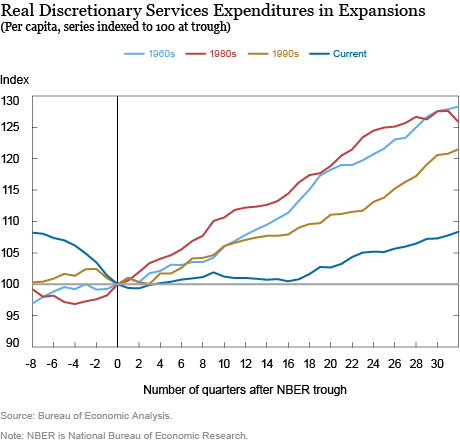
Having recently passed the eight-year anniversary of the trough of the Great Recession (June 2009, based on the NBER dating), the current expansion has become the third-longest in U.S. economic history. So in thinking about the pace of recovery for discretionary services spending, I compare the pace seen in the current expansion with that seen in the three other recent expansions—the 1960s and 1990s expansions, which lasted longer than the current expansion, and the 1980s expansion, which lasted almost as long.
To do so, I present a chart that shows real per capita discretionary services expenditures indexed to 100 in the quarters marking the end of each of the four respective recessions. This type of chart allows me to compare the pace of recovery in discretionary services spending across business cycles. As shown below, the pace of recovery in the current cycle remains considerably below that of the other long expansions. As of the second quarter of 2017, these expenditures were only 8 percent above their level at the 2007-09 recession’s trough. In contrast, at this point in the other pictured expansions, expenditures were more than 20 percent above the level at each respective recession’s trough.
Much of the gap between the current and previous long expansions occurred early in the expansions: Four years into the current expansion, discretionary services expenditures were only marginally above the level seen at the trough of the business cycle. Nevertheless, this gap continued to widen over the subsequent four years.

The slow recovery in discretionary services expenditures is consistent with other unusual features of this expansion, such as the slow growth of both real income and labor productivity—all of which are fundamental determinants of consumption.
The analysis of the behavior of productivity by John Fernald of the San Francisco Fed and the regime-switching model of productivity growth by Kahn-Rich both indicate that the longer-term trend of productivity growth has been relatively low since the mid-2000s. Given that economic theory suggests that consumption is affected by expectations of future income growth (which are in turn influenced by productivity growth), the continued relatively slow growth of discretionary services expenditures suggests that households still expect slow productivity growth going forward.
Disclaimer
The views expressed in this post are those of the author and do not necessarily reflect the position of the Federal Reserve Bank of New York or the Federal Reserve System. Any errors or omissions are the responsibility of the author.

Jonathan McCarthy is a vice president in the Federal Reserve Bank of New York’s Research and Statistics Group.
How to cite this blog post:
Jonathan McCarthy, “Discretionary Services Spending Has Finally Made It Back (to 2007),” Federal Reserve Bank of New York Liberty Street Economics (blog), October 16, 2017, http://libertystreeteconomics.newyorkfed.org/2017/10/discretionary-services-spending-has-finally-made-it-back-to-2007.html.


 RSS Feed
 Follow Liberty Street Economics
Ryan, thanks for the comment and question. I agree that household deleveraging and tighter credit supply following the GFC likely were among the factors behind the weakness of consumer spending during the recession and afterwards. Those factors also have been cited in commentary about consumer spending weakness, including speeches by New York Fed President Dudley, and in academic research (for example, a number of papers by Atif Mian and Amir Sufi). Nevertheless, as documented in the post, discretionary services spending in this cycle remains subdued compared to previous cycles, even after the deleveraging process appears to have been completed. So other factors, including continued slow productivity growth that I cite in the post, probably have been contributors. How much to assign to these various factors requires more research.
Hi Jonathan, To what extent do you think this a function of access to or availability of credit? For example, given the depth of the deleveraging that took place during the GFC is it plausible that people were simply less able to finance discretionary expenditures through credit cards etc? Thanks, Ryan