As the midterm elections approach, it’s worth revisiting the striking financial market response to the last federal elections in 2016. U.S. equity market futures and Treasury yields first plunged on election night 2016, as the presidential election results turned out closer than expected, but quickly rebounded after President Trump’s victory became clear, ultimately ending the day higher. In this post, I take a close look at the unusual U.S. Treasury market behavior that night, focusing on the market conditions and trading flows amid which the sharp yield changes took place.
U.S. Treasury Securities Trade Round-the-Clock
U.S. Treasury securities trade 22-23 hours per day during the trading week, as discussed in this Economic Policy Review article. The trading day for Wednesday, November 9, 2016 thus started at about 6:30 p.m. eastern time on Tuesday, November 8 (when it was already Wednesday morning in Asia), and continued until about 5:30 p.m. on November 9. This round-the-clock trading enables the market to immediately react to overnight news, such as election results. That said, the market is typically much less active during the overnight hours.
Treasury Yields Initially Plunged as Election Returns Came In
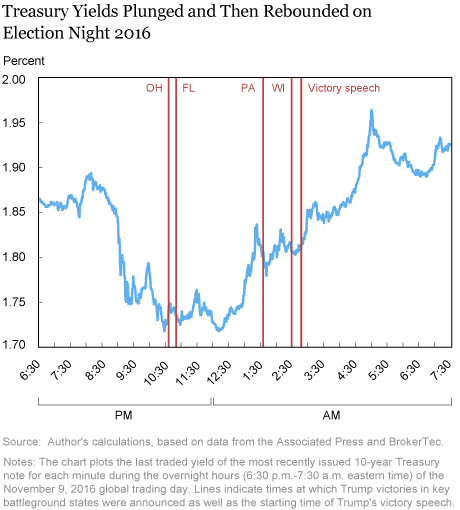
As shown in the chart below, the 10-year Treasury yield was about 1.86 percent when the global trading day opened on November 9, basically unchanged from the previous trading day’s close. The yield rose as high as 1.89 percent at 8:09 p.m., before beginning a modest and then severe decline. In the fifteen minutes between 8:59 and 9:14 p.m., in particular, the yield plunged from 1.85 percent to 1.75 percent. The yield then reached an intraday low of 1.72 percent at 10:28 p.m., and then traded at that level in the 12:05-12:20 a.m. range.

Although the yield declines preceded the announcements of Trump victories in key battleground states, they occurred as expectations of a Trump victory were rising sharply. The New York Times’ Upshot model, for example, put the probability of a Trump win at 18 percent at 8 p.m., 30 percent at 9 p.m., 63 percent at 10 p.m., and 95 percent at 11 p.m. Market commentary pointed to uncertainty about the eventual winner and uncertainty about Trump’s economic positions as explanations for the plunging equity market futures and Treasury yields.
Yields Then Sharply Rebounded
Shortly after reaching its intraday low, the 10‑year yield surged higher, eventually reaching an overnight peak of 1.96 percent at 5:00 a.m. The yield then retreated somewhat, but surged again through the remainder of the morning, reaching a daily high of 2.08 percent at 1:23 p.m., and ending the day at 2.06 percent. The yield rebound came as remaining uncertainty about the winner of the presidential election was resolved, with a Trump victory speech that was seen as more conciliatory than expected, and with heightened expectations of expansionary fiscal policy in the new administration.
For the overnight hours (defined here as 6:30 p.m. – 7:30 a.m.), the 10‑year yield traded in a 25 basis point range. This is the second-largest overnight trading range observed over the January 2001 – June 2018 period (the largest occurred with the June 2016 Brexit vote), and roughly seven times greater than the average overnight trading range of 3½ basis points. The full-day trading range of 37 basis points was also unusually large and, by coincidence, matches the 10-year note’s trading range for the day of the “flash rally,” October 15, 2014, as described in this Liberty Street Economics post.
Yield Changes Occurred amid Good Market Liquidity
The Treasury market was active and liquid on election night. Overnight trading volume in the 10-year note on the BrokerTec trading platform (described in this New York Fed staff report) totaled $56 billion. This was the highest overnight volume in the note since BrokerTec’s inception in June 2000. The volume was also roughly 8½ times larger than the average overnight volume of $6.5 billion for the January 4 to November 8, 2016 period.
Bid-ask spreads on the BrokerTec platform remained narrow throughout the overnight period as well. The average spread between the best bid and offer prices for the 10-year note during the overnight hours was 0.60 32nds of a point (a point equals one percent of par). This was not much higher than the note’s minimum price increment and spread of ½ 32nd, and comparable to the average overnight spread of 0.56 32nds for the January 4 to November 8, 2016 period.
Limit-order book depth on the BrokerTec platform, in contrast, was somewhat lower than usual, averaging $162 million for the 10-year note during the overnight hours (calculated as the sum of bid and offer depths at the five best bid and offer prices). This compares with average overnight depth of $319 million for the January 4 to November 8, 2016 period.
Can Trading Activity Explain the Yield Changes?
What role did trading activity play in the path of yields on election night? Yield changes can occur without trading when public information arrives, as shown in this Journal of Finance article (released earlier as a New York Fed staff report). But information is also revealed through the trading process. Trades initiated by buyers tend to cause prices to rise (that is, yields to fall) and those initiated by sellers tend to cause prices to fall (yields to rise).
Trading activity does help explain the yield changes on election night. During the period when yields were falling, defined as the period from the market open until 10:28 p.m., buyer-initiated trades in the 10-year note exceeded seller-initiated trades by 574 (on the BrokerTec platform). Conversely, during the overnight period when yields were rising, defined as the period from 12:12 to 7:30 a.m., seller-initiated trades exceeded buyer-initiated trades by 1,273.
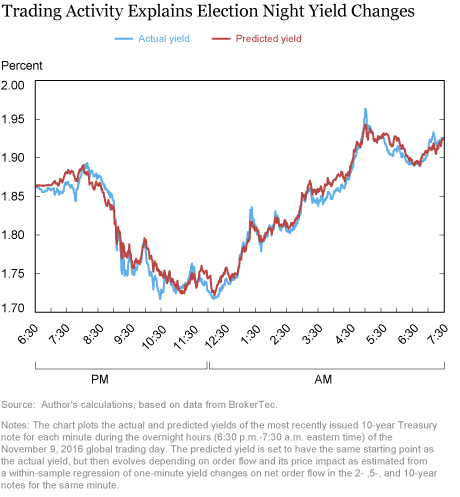
But can the trading activity explain the extent of the yield changes? To assess this, I first estimate the relationship between net order flow (buyer-initiated trades less seller-initiated trades) and yield changes on election night. I do this by regressing yield changes on net order flow for each minute of the overnight hours. I find that the 10-year yield tended to fall by 5.6 basis points per 100 net buyer-initiated trades in the 10-year note. The 10-year yield is also affected by order flow in other securities, so that it tended to fall 5.8 basis points and 3.9 basis points per 100 net buyer-initiated trades in the 2- and 5-year notes.
I then create a hypothetical yield path on election night by assuming that the 10-year yield was driven by the observed order flow in the 2-, 5- and 10-year notes alone, and to the extent predicted by the model. As shown in the next chart, the predicted yield path almost exactly matches the actual yield path. That is, election night yield changes are well explained by Treasury market order flow. Developments in other markets and public information (defined as information that moves prices without trading) seemingly played minor roles in directly causing the yield changes.

Summing Up
While this analysis does not try to ascertain why market sentiment shifted so suddenly on election night, I can draw two conclusions. First, the fact that the Treasury yield changes occurred amid good market liquidity suggests that the yields reflected a broad range of market participants’ expectations that night, as opposed to being driven by few orders amid poor liquidity. Second, the fact that the yield changes are largely explained by net order flow suggests that much of the price discovery was occurring via trading in the market, as opposed to Treasury yields simply responding to developments elsewhere.
Disclaimer
The views expressed in this post are those of the author and do not necessarily reflect the position of the Federal Reserve Bank of New York or the Federal Reserve System. Any errors or omissions are the responsibility of the authors.

Michael J. Fleming is a vice president in the Federal Reserve Bank of New York’s Research and Statistics Group.
How to cite this blog post:
Michael J. Fleming, “U.S. Treasury Market Action on Election Night 2016,” Federal Reserve Bank of New York Liberty Street Economics (blog), October 24, 2018, https://libertystreeteconomics.newyorkfed.org/2018/10/us-treasury-market-action-on-election-night-2016.html.


 RSS Feed
 Follow Liberty Street Economics