Expectations of creditor recovery were low when the Lehman Brothers bankruptcy process started. On the day the firm filed for bankruptcy in September 2008, the average price of Lehman’s senior bonds implied a recovery rate of about 30 percent for senior creditors. A month later the bond price was implying a recovery rate of 9 percent, consistent with results from Lehman’s CDS auction. Two and a half years later, Lehman’s estate estimated that the recovery rate for holding company creditors would be just 16 percent. So, ten years after the filing, how much did creditors actually recover?
Recovery Rate for Lehman’s Third-Party Creditors
Claims against Lehman’s holding company and its twenty-two affiliates fall into two broad groups: 1) those of third-party creditors and 2) those by Lehman affiliates against one another. Our focus is on the former. Under a plan that Lehman submitted to the court on June 29, 2011, total claims by third-party creditors allowed by Lehman’s estate—after adjusting for duplicate, invalid, or inflated claims—were $362 billion. The plan estimated that about $84 billion of assets could be recovered, or $75 billion after deducting expenses, amounting to a recovery rate of about 21 percent.
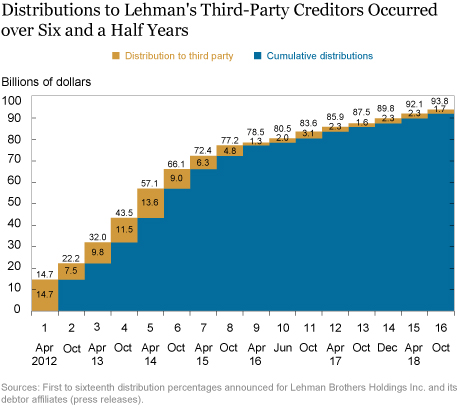
Starting in April 2012, the Lehman estate made sixteen cash distributions to creditors. The total amount distributed was more than $126 billion, out of which almost $94 billion went to third-party creditors. We estimate the total allowed claims to third-parties as $304-312 billion, implying a recovery rate for third-party creditors of about 31 percent (see chart below).
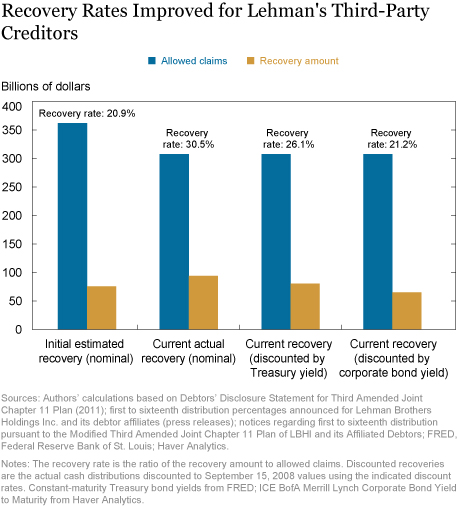
Why is the current recovery rate nearly double that of Lehman’s initial estimate of 16 percent? The main reason is that prices of assets held by Lehman increased as the economy recovered during bankruptcy proceedings, especially for loans, real estate, and private equity investments. Also, some large-value disputed claims (for example, by certain derivatives counterparties and JPMorgan Chase) were decided by the court in Lehman’s favor, reducing the amount of allowed claims.
The Cost of Delayed Recovery
While the delays in reaching a resolution promoted recovery as asset prices improved, the delays also reduced the value of the amounts recovered. Payments made years after bankruptcy are necessarily worth less than more timely payments because of the time value of money. Moreover, creditors lost the liquidity value of their assets over the resolution period. These costs are particularly high in Lehman’s case since the firm’s time in default is so far about eight times greater than the typical bankruptcy length of fourteen months. Indeed, soon after the bankruptcy filing, some creditors sold their claims to distressed-debt-investing hedge funds.
To account for delays, we estimate the present value of the recovery to creditors as of September 15, 2008, as the discounted value of the actual distributions. Our discount rate is either the Treasury yield or a corporate bond yield, both with maturity equal to the time difference between the actual distribution date and September 15, 2008. Treasury yields account for the time value of money, but underestimate the true discount rate since they ignore the liquidity premium. Corporate bond yields include a liquidity premium, albeit one that is likely too small (because corporate bonds are more liquid than bankruptcy claims), but also a credit-risk premium. The difference between corporate bond yields and Treasury yields is thus a rough estimate of the liquidity premium, which may be somewhat high or low.
We find the present value of recovery for third-party creditors as $80 billion using Treasury yields and $65 billion using corporate bond yields, as compared to the $94 billion nominal value of the sixteen distributions (see chart below). The $14 billion difference between $94 billion and $80 billion measures the time value of money and the $15 billion difference between $80 billion and $65 billion represents the lost liquidity value. Adjusted for these factors, the recovery rate declines to between 21 percent and 26 percent (see the chart above).
Recovery Rates for Different Creditors
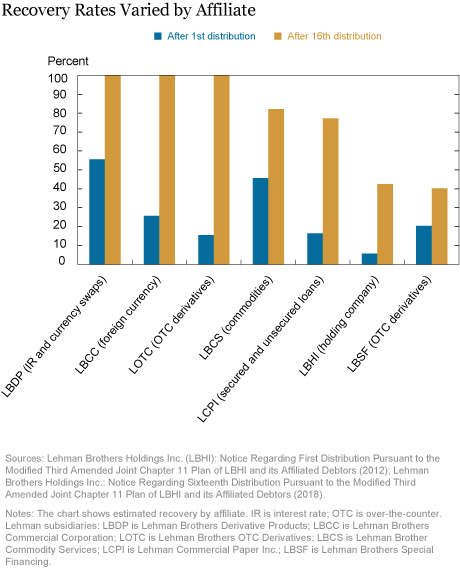
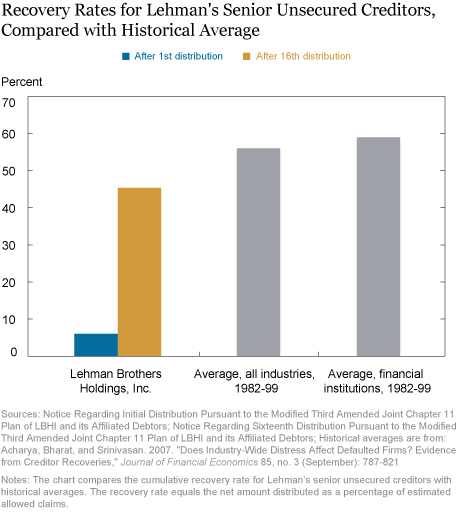
The recovery rates of Lehman’s various affiliates also improved over time, although there was substantial variation. Creditors of most of Lehman’s derivative entities (Lehman Brothers Commodity Services (LBCC) and Lehman Brothers OTC Derivatives (LOTC) in chart below) recovered 100 percent of their claims, as most of these affiliates had positive net worth at the time of bankruptcy. One exception is Lehman’s largest derivatives entity Lehman Brothers Special Financing (LBSF). Its creditors received just 40 percent of their claims because in part, under Lehman’s liquidation plan, their claims were reduced in favor of unsecured counterparties of the holding company LBHI. In contrast, general unsecured creditors of LBHI benefited from the liquidation plan, as their recovery rate improved from just 6 percent initially to 45 percent after the sixteenth distribution.
In spite of enhanced recovery, Lehman’s creditors fared worse than historical norms. To compare like to like, we compare the recovery rates for senior unsecured creditors of LBHI and firms in prior bankruptcies (see chart below). Average recovery rates in bankruptcy for senior unsecured claims between 1982 and 1999, based on market prices of bonds, loans, and other debt instruments, were about 56 percent for all industries and 59 percent for financial institutions. Although our lower estimates for Lehman are based on book prices, market prices of LBHI’s senior bond have closely tracked recovery rates (for example, Lehman’s bond prices in 2013 implied a recovery rate of 39 percent). Moreover, the present value of recoveries for senior unsecured creditors of LBHI, which is what’s reflected in market prices, is likely even lower than historical norms. That’s because Lehman remained in bankruptcy longer than most bankrupt firms.
Customers of Lehman’s Broker-Dealer
While LBHI and its subsidiaries were in Chapter 11 bankruptcy, Lehman’s broker-dealer, Lehman Brothers Inc. (LBI), was resolved under a separate regime called the Securities Investor Protection Act (SIPA). Different from Chapter 11, SIPA was a liquidation proceeding, with an emphasis on returning customer property wherever possible. In this goal, the SIPA Trustee succeeded. Customers of LBI recovered 100 percent of their claims, worth almost $190 billion. About half of the claims were resolved quickly when Lehman customer accounts were transferred to Barclays, Neuberger Berman, and other solvent broker-dealers. The remaining, mostly institutional, customer claims were resolved more slowly through the SIPA claims process, which was essentially completed by March 2013.
Disclaimer
The views expressed in this post are those of the authors and do not necessarily reflect the position of the Federal Reserve Bank of New York or the Federal Reserve System. Any errors or omissions are the responsibility of the authors.
 Erin Denison is a senior research analyst in the Federal Reserve Bank of New York’s Research and Statistics Group.

Michael J. Fleming is a vice president in the Bank’s Research and Statistics Group.

Asani Sarkar is an assistant vice president in the Bank’s Research and Statistics Group.
How to cite this blog post:
Erin Denison, Michael J. Fleming, and Asani Sarkar, “Creditor Recovery in Lehman’s Bankruptcy,” Federal Reserve Bank of New York Liberty Street Economics (blog), January 14, 2019, https://libertystreeteconomics.newyorkfed.org/2019/01/creditor-recovery-in-lehmans-bankruptcy.html.



 RSS Feed
 Follow Liberty Street Economics