The United States imposed new import tariffs on about $283 billion of U.S. imports in 2018, with rates ranging between 10 percent and 50 percent. In this post, we estimate the effect of these tariffs on the prices paid by U.S. producers and consumers. We find that the higher import tariffs had immediate impacts on U.S. domestic prices. Our results suggest that the aggregate consumer price index (CPI) is 0.3 percent higher than it would have been without the tariffs.

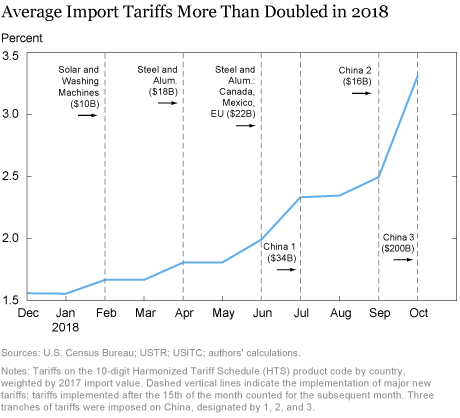
Average import tariffs, calculated by averaging across countries and Harmonized Tariff Schedule (HTS) product codes using 2017 import weights, increased from an average of 1.6 percent to 3.3 percent (see chart above). The increases include:
- Tariffs of 30 percent on solar panels and 20-50 percent on washing machines in late January 2018.
- Tariffs of 25 percent on steel and 10 percent on aluminum in late March 2018 with some countries made exempt; tariff coverage was broadened to include Canada, Mexico, and the EU in June 2018.
- Three tranches of tariffs on China: 25 percent tariffs on $34 billion beginning in July 2018; 25 percent tariffs on another $16 billion in late August; and a further set of 10 percent tariffs on another $200 billion at the end of September, a rate that may increase to 25 percent in 2019. The first two tranches were levied largely on intermediate inputs and capital equipment, while the last tranche was levied more heavily on consumer products.Although the average tariff rate is still low, there is a lot of dispersion across products and countries, and they cover a large share of U.S. imports–12 percent of total imports were affected by the new tariffs. Now, more than 10 percent of imports face a tariff rate greater than 10 percent, whereas only 4 percent had such high tariff rates in 2017.
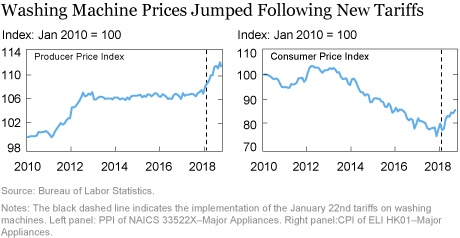
In general, we expect an import tariff to increase the domestic price of the good on which it is imposed. For example, when tariffs of 20 percent to 50 percent were imposed on washing machines in late January 2018, the categories in both the Producer Price Index (PPI) and the CPI that encompass these products jumped up almost immediately, as seen in the chart below.

While it is easy to find specific examples like washing machines, it is more difficult to assess the broader price effects of the import tariffs as there are very few studies that estimate the effect of import tariffs on domestic prices. For developed countries, tariffs have been low for a long time so there has been little tariff variation that could be studied (until now).
To understand how the new tariffs can affect U.S. domestic prices, we draw on a research paper by Amiti, Itskhoki, and Konings (2018) that helps shed light on the mechanisms through which tariffs affect domestic prices. First, the paper finds evidence that domestic producers change their prices in response to changes in foreign prices even if their own marginal costs are unaffected. For example, a tariff on steel, which raises the prices of imported steel, also enables domestic steel producers to increase their prices while still staying competitive relative to foreign-produced steel.
Second, the price effects filter through the economy through input-output linkages. Firms that are dependent on steel as an intermediate input face higher input prices and therefore higher marginal costs. They respond to this by either increasing their prices or reducing their markups or both. Amiti, Itskhoki, and Konings (2018) show that small firms pass through almost the entire marginal cost shock to domestic prices, whereas large firms have a lower cost pass-through and also adjust their markups.
These findings suggest that in order to estimate the effect of import tariffs on domestic prices, it is important to take into account the tariff effects on both the firm’s marginal costs and competitor prices. Unfortunately firm product-level price data for the United States are unavailable, so we use industry-level PPI changes. The PPI measures the price charged by producers for their goods or services. It is constructed by the BLS from a monthly survey of establishments representing nearly the entire goods sector and 70 percent of services. It includes both the prices charged by producers for final goods (for example, household appliances), which could be sold to wholesalers, retailers, or directly to consumers, as well as the prices charged for intermediate products. We use industry-level PPI regressions instead of CPI because a tight mapping between international products and domestic industry categories is only available for PPI industry categories (that is, NAICS) and not for CPI industry categories.
We estimate the effect of the import tariffs on domestic prices through regression analysis, using monthly NAICS industry-level data for the period January 2017 to October 2018. We regress the three-month change in the log PPI of an industry on the three-month change in the average tariff of the goods produced by the industry, which we refer to as the output tariff. We also include the industry’s input tariff, which we calculate as the cost share–weighted average tariff rate across all the intermediate inputs used to produce the industry’s output. While the input tariff is a proxy for the change in the marginal costs of firms in an industry, the output tariff is a proxy for the change in competitor prices in each industry. To illustrate with an example: In the washing machine industry, the output tariff is the import-weighted average of all tariffs on all individual products (at HTS10-digit level) imported from all countries that map to the NAICS washing machine industry; the input tariff for this industry is a cost share–weighted average of all the intermediate inputs used to produce washing machines.
Our results show that both the output tariffs and input tariffs have a positive and significant effect on an industry’s PPI, with a 10 percentage point increase in output tariffs increasing an industry’s PPI by 1.5 percent and the same increase in its input tariff raising the industry’s PPI by 2.3 percent. These effects are quite large given that these are domestic prices rather than import prices, which do not enter directly in the PPI. The effects are of similar magnitude for the sample of manufacturing industries (18 percent of aggregate production) and when we extend the sample to include agriculture and services (for which our data cover 46 percent of total production). Even though a service industry may not have an output tariff, we can still calculate an input tariff levied on the intermediate inputs it imports.
We find that the price increases are noticeable fairly quickly, occurring within a three-month period of the new tariffs. However, given the short time that has passed since the implementation of the tariffs, we are unable to assess long-run effects at this stage.
Inferring aggregate effects from the regression analysis is difficult because the coefficients inform us about relative price effects. Nevertheless, a back of the envelope calculation using the regression coefficients and the actual changes in tariffs is still informative—they suggest an effect on aggregate PPI of around a third of a percentage point. The correlations between the overall PPI and CPI suggest a pass-through that yields CPI effects of similar magnitude to the PPI effects.
In sum, our analysis suggests that that producer and consumer prices are about a third of a percent higher in 2018 as a result of higher import tariffs.
Disclaimer
The views expressed in this post are those of the author and do not necessarily reflect the position of the Federal Reserve Bank of New York or the Federal Reserve System. Any errors or omissions are the responsibility of the author.
 Mary Amiti is an assistant vice president in the Federal Reserve Bank of New York’s Research and Statistics Group.
 Sebastian Heise is an economist in the Bank’s Research and Statistics Group.
 Noah Kwicklis is a senior research analyst in the Bank’s Research and Statistics Group.
How to cite this blog post:
Mary Amiti, Sebastian Heise, and Noah Kwicklis, “The Impact of Import Tariffs on U.S. Domestic Prices,” Federal Reserve Bank of New York Liberty Street Economics (blog), January 4, 2019, https://libertystreeteconomics.newyorkfed.org/2019/01/the-impact-of-import-tariffs-on-us-domestic-prices.html.


 RSS Feed
 Follow Liberty Street Economics
Got it. Thanks for the clarification.
Since the washing machine tariff was assigned to February, then the graph will show an increase between January and February. There would only be an increase in March if there were another new tariff in March. The reason that graph shows an increase in June and July is because there were new tariffs assigned in June (a second wave of the steel tariffs) and in July (the first tranche of the China tariffs). I hope this helps clarify the points in Figure 1.
Thanks for your feedback. I suppose my question wasn’t clear. I understand what you explained. My question was whether you understood why the Average Import Tariff line in Figure 1 remained flat after new tariffs were implemented. In the case you mentioned, the tariff on washing machines were implemented on Jan. 22, you assigned them to Feb, but the Average Import Tariff remains flat between Feb and March. Washing machines do not account for much imports so maybe the increase is no visible in this case. But we can observe the same pattern for the Steel and Aluminum tariff, which are quantitatively bigger so should show up in Average Import Tariff. In this case, tariffs go into effect on March 23 https://piie.com/system/files/documents/trump-trade-war-timeline.pdf, so you assign them to April, but the Average Import Tariff value isn’t affected until May. Was that because there was a further lag in the actual implementation of these tariffs? That pattern doesn’t appear to apply for the second wave of Steel and Aluminum tariff. In June, the slope of the Average Import Tariff appears affected exactly when the new tariffs are implemented, not with a one-month lag.
Thank you for your comment. Because the prices in the PPI are the prices reported around the middle of the month (https://www.bls.gov/ppi/ppifaq.htm), we decided to assign the tariff change to the following month if the date of implementation was after the 15th and to the current month if the tariff was before then. For example, the washing machine tariffs were implemented on January 22 so we assigned this tariff change to the month of February.
Do you know why there seems to be a one-month lag between the implementation date of several tariffs (e.g washing machines, steel, china 1) and actual implementation of higher tariffs as revealed by data on average import tariffs (blue line in your first figure)?