In two previous blog posts (from January 2017 and December 2017), we examined political polarization in economic expectations in the period immediately after the 2016 presidential election using the Survey of Consumer Expectations (SCE). Today, we begin a two-part series that revisits the issue. In this post, we provide an update on how economic expectations have evolved in counties where a plurality voted for Donald Trump in 2016 and counties where a plurality voted for Hillary Clinton. In a second post, we will look at how economic expectations differed in the run-up to the 2018 congressional elections, based on how districts ended up voting in that election.
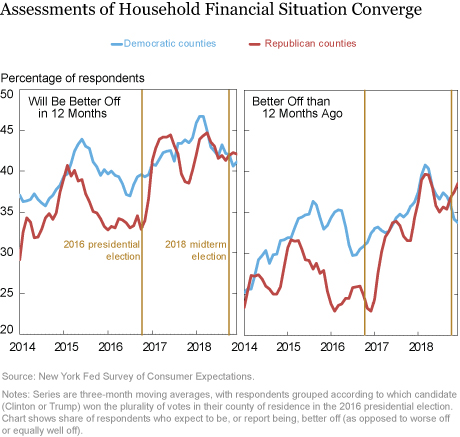
We begin by examining respondents’ assessments of their household financial situation. The left panel of the chart below shows the percentage of respondents who say they expect to be better off financially a year from now, while the right panel shows the percentage of respondents who say they are better off financially than they were a year ago. In all of the charts in this blog, we split the sample into respondents in counties where a plurality voted for Donald Trump in 2016 (henceforth, “Republican counties”) and respondents in counties where a plurality voted for Hillary Clinton in 2016 (“Democratic counties”). Note also that the charts in this blog post display three-month moving averages.

As reported in our December 2017 blog post, Democratic counties were more optimistic about personal financial conditions than Republican counties prior to the 2016 election, but Republican counties became sharply more optimistic after the election. However, this trend inverted in Republican counties during the fall of 2017 (they suddenly became more pessimistic), while optimism in Democratic counties kept rising. While we cannot be certain of what caused this inversion of perceptions, we note that two high-profile attempts to repeal the Affordable Care Act did not pass the Senate during this period (the “skinny repeal” in late July and the Graham-Cassidy bill in late September).
By the time we wrote our December 2017 blog post, it appeared that political polarization had almost returned to the pre-election level, with those residing in Republican counties being systematically less optimistic about their personal financial situation than those in Democratic counties.
However, following the passage of the Tax Cuts and Jobs Act in late December 2017, Republican counties once again became much more optimistic about their financial situation. In fact, for most of 2018 there is little difference in the perceptions and expectations reported by Democratic and Republican counties. In particular, both groups turned more pessimistic about their personal financial situation in the spring of that year (possibly due to stock market fluctuations, escalations in trade tensions, or weakening in the housing market during that period).
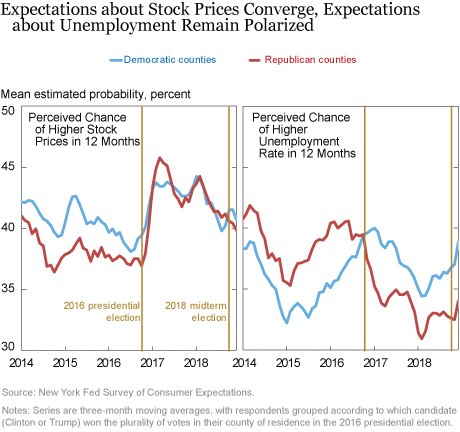
While political polarization in the assessment of households’ own financial situation appears to have decreased, the patterns that emerge in expectations about the overall U.S. economy are more varied. As in our previous blog post, we first examine the average perceived likelihood that U.S. stock prices (left panel below) and U.S. unemployment (right panel below) will be higher one year later. In the years before the 2016 election, Republican counties were consistently less bullish than Democratic counties about the stock market. After a large increase in optimism in both Democratic and Republican counties after the 2016 election, expectations about stock prices have been nearly indistinguishable between the two groups since February 2018. In particular, stock market expectations fell over most of 2018.

In contrast, there is still a strong polarization in expectations about future unemployment. Prior to mid-2016, Democratic counties were consistently reporting a lower probability of a higher year-ahead unemployment rate than Republican counties. While that pattern reversed in the months following the election, since mid-2017 expectations have moved nearly in parallel in Democratic and Republican counties, with Republican counties consistently reporting a lower average likelihood of an increase in year-ahead unemployment than Democratic counties.
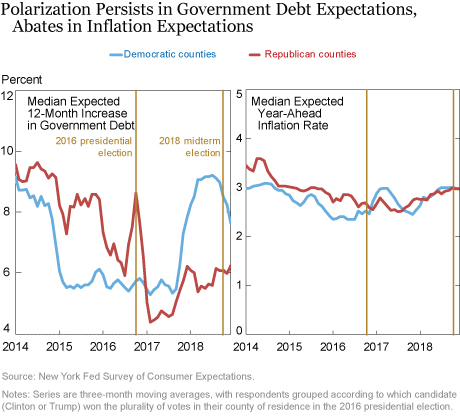
We find similar trends when we focus on government debt and year-ahead inflation expectations. The left panel of the chart below shows the median expected increase in government debt over the next year, and the right panel shows the median one-year-ahead expected inflation rate. Republican counties anticipated higher growth in debt prior to the 2016 election, then reported a sharp decline in expected growth after the election, followed by a modest increase since early 2017. Expectations of debt growth stayed relatively constant in Democratic counties through the 2016 election, before rapidly increasing in late 2017, around the time that the Tax Cuts and Jobs Act was signed into law. After peaking in mid-2018, expectations for debt increases have begun to decline in Democratic counties. However, this measure still shows some of the widest gaps between Democratic and Republican counties of any expectations measure that we examine in this blog post.

In the right panel of the chart, however, we can see that expectations of year-ahead inflation have largely converged since mid-2018 between Democratic and Republican counties. Before the 2016 election, Republican counties reported a persistently higher expected rate of inflation than Democratic counties. After the 2016 election, inflation expectations immediately increased in counties that voted for Hillary Clinton, before dipping in late 2017 below the average across counties that voted for Donald Trump. Since then, expectations in Democratic counties have increased to match the expectations in Republican counties.
In summary, some of the political polarization we documented before and in the wake of the 2016 election has abated. While Republican counties have remained more optimistic about government debt growth and future unemployment, expectations in Republican and Democratic counties have become essentially indistinguishable over the past year in terms of their expectations about changes in their financial situation, inflation, and the stock market. A natural question that arises is whether breaking down our sample using the 2016 county vote share is still an effective proxy for political inclination two years after the election. We will explore this issue in our next blog post, which will break down our expectations data according to the results of the 2018 congressional elections.
Disclaimer
The views expressed in this post are those of the authors and do not necessarily reflect the position of the Federal Reserve Bank of New York or the Federal Reserve System. Any errors or omissions are the responsibility of the authors.
 Olivier Armantier is an assistant vice president in the Federal Reserve Bank of New York’s Research and Statistics Group.
 Michael Neubauer is a senior research analyst in the Bank’s Research and Statistics Group.
 Daphne Skandalis is an economist in the Bank’s Research and Statistics Group.
 Wilbert van der Klaauw is a senior vice president in the Bank’s Research and Statistics Group.
How to cite this blog post:
Olivier Armantier, Michael Neubauer, Daphne Skandalis, and Wilbert van der Klaauw, “Economic Expectations Grow Less Polarized since the 2016 Election,” Federal Reserve Bank Bank of New York Liberty Street Economics (blog), May 13, 2019, https://libertystreeteconomics.newyorkfed.org/2019/05/economic-expectations-grow-less-polarized-since-the-2016-election.html.


 RSS Feed
 Follow Liberty Street Economics