It’s tempting to compare the economic fallout from the coronavirus pandemic to prior business cycle downturns, particularly the Great Recession. However, such comparisons may not be particularly apt—as evidenced by the unprecedented surge in initial jobless claims over the past three weeks. Recessions typically develop gradually over time, reflecting underlying economic and financial conditions, whereas the current economic situation developed suddenly as a consequence of a fast-moving global pandemic. A more appropriate comparison would be to a regional economy suffering the effects of a severe natural disaster, like Louisiana after Hurricane Katrina or Puerto Rico after Hurricane Maria. To illustrate this point, we track the recent path of unemployment claims in the United States, finding a much closer match with Louisiana after Katrina than the U.S. economy following the Great Recession.
Why Is This Time Different?
Although many observers are comparing the current economic cycle to the Great Recession, the two situations are very different. First, the Great Recession was driven by economic and financial imbalances, while the current situation results from a non-economic shock. Second, the Great Recession developed gradually—first as a sub-prime mortgage crisis, then as a broader housing bust, and eventually as a full-blown global financial crisis and recession. The coronavirus pandemic, in contrast, came on suddenly, hitting the economy at full force in one month. Third, the current pandemic is widely viewed as a temporary situation with an endpoint, though how soon that endpoint is reached is of utmost concern and remains to be seen.
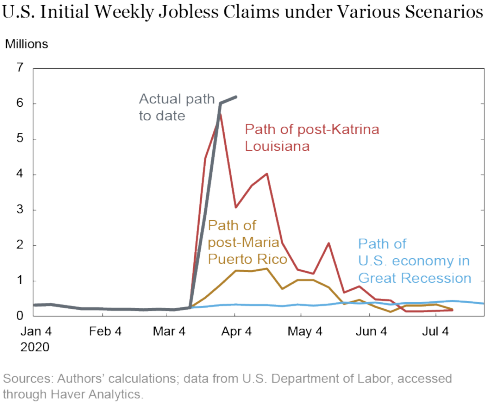
Given the nature of the current crisis, a better benchmark for assessing the current economic cycle would be the regional economic impact of a severe natural disaster, as seen in Louisiana’s economy after Hurricane Katrina or Puerto Rico’s economy after Hurricane Maria. The most complete, timely economic data available are initial jobless claims, and we have seen an unprecedented surge in this series since mid-March—much sharper than the rise during the Great Recession. Thus far, the recent surge in jobless claims has tracked the pattern observed in post-Katrina Louisiana fairly closely, well above the initial post-Maria upswing in Puerto Rico.
A Katrina-Level Event—but at a National Scale
Below we plot a few hypothetical scenarios of the path that initial jobless claims in the United States would take if it followed the same pattern as it did in Louisiana after Katrina, Puerto Rico after Maria, and the overall economy during the Great Recession. For each case, we do this by scaling the post-event rise in claims up to the magnitude applicable to the U.S. employment base today. For example, jobless claims peaked at 74,000 (71,000 above normal levels) two weeks after Katrina; since the United States today has 78 times as many total workers today as Louisiana had then, this translates into a level of about 5.7 million—which is still below, but close to, the past week’s nationwide level of 6.2 million (6.0 million above normal). The path of jobless claims thus far seems to be tracking somewhat above but close to the Katrina-like scenario. It is also well above the path based on Puerto Rico after Maria.

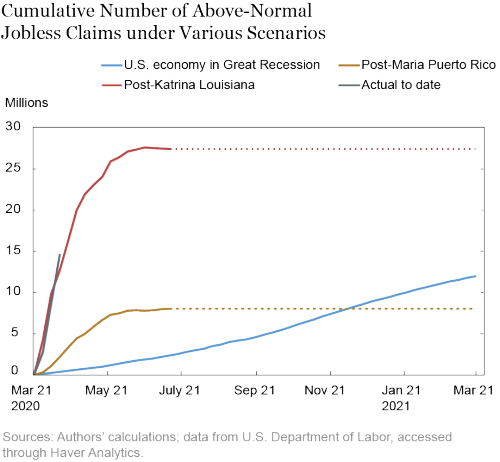
The sustained but gradual rise in claims following the Great Recession is barely visible compared to the current situation. In a typical recession, jobless claims often build gradually and persist over time, which was particularly true during the Great Recession, as opposed to coming on suddenly. Therefore it is also useful to examine the cumulative path of claims, shown below.

For this exercise, we estimate how many excess claims occur that are above normal levels using historical patterns, scaling to the national level as in the last chart. When a line levels off, that indicates that there are no new excess claims, suggesting that the event’s effects on jobless claims has run its course. Here we see that the cumulative number of excess jobless claims spikes in both hurricane scenarios, especially in the one based on Katrina, and then levels off. Again, the parallels to Katrina are striking. This means that if the overall U.S. economy were to follow the same pattern today, we could see more than 27 million pandemic-related claims by the end of May.
In spite of the similarity of these paths, there are clearly some major differences between the current pandemic and Hurricane Katrina. First, in Katrina a great deal of capital and infrastructure was destroyed or severely damaged. The pandemic is not taking such a toll today, which may well facilitate a quicker economic recovery. Second, the post-Katrina outlook was less uncertain. Once the hurricane passed, the recovery began. As New York’s governor has aptly noted, the coronavirus pandemic is like a slow-moving hurricane—and we’re not even sure how slow-moving it is yet. Third, many people and businesses moved away from Louisiana, especially New Orleans, in the wake of Katrina, limiting the speed and scale of the subsequent rebound in economic activity. Such an exodus cannot occur as easily in this case, since the disaster is affecting the entire country. Fourth, Katrina’s blow to the regional economy partly resulted from a loss of power and communications, whereas in the current environment, these systems have actually helped to offset the disruptive effects.
However, there are also many parallels between the impact of Katrina and the effects of the pandemic to date. The economy was growing prior to the event in both cases. And, both after Katrina and in recent weeks, the brunt of the job losses have occurred in the leisure and hospitality sector (restaurants, bars, hotels, etcetera). That is typically the hardest-hit sector after natural disasters, because people are reluctant to travel to a storm-ravaged area. Similarly, given that social distancing heavily affects leisure and hospitality and may continue at least sporadically for months to come, this sector may have difficulty rebounding.
How Bad Were the Katrina Job Losses?
Owing to the different natures of these disasters, it’s hazardous to use the Katrina example to forecast where the U.S. economy is heading. However, it is useful to review what happened to Louisiana’s economy in the weeks and months after Katrina. Payroll employment fell by 9 percent over the two months following Katrina, and then gradually began to recover, reversing about half the loss within ten months. Meanwhile, the unemployment rate surged from 5.4 percent in August to 11.3 percent in September, and stayed above 11 percent for three months before retreating to a new low of 4.9 percent by January. The remarkable divergence in these two indicators reflects the mass net out-migration—6 percent of the state’s adult population—that occurred during this period. As noted before, this is clearly unlikely to occur in the aftermath of the current pandemic.
One thing to note when translating jobless claims into subsequent job losses: over the ten weeks after Katrina, while the number of excess (greater than usual) jobless claims added up to 18 percent of pre-Katrina employment, the actual net job loss was roughly 9 percent. This should lead analysts to think twice about assuming that every jobless claim translates into a net job loss. Moreover, the recent expansion of unemployment insurance coverage to gig workers and contractors adds further uncertainty to the relationship between jobless claims and subsequent payroll job losses.
Conclusion
This blog post is not intended to present a prediction of the economic fallout from the current pandemic, but rather to provide a framework for thinking about its economic effects and for interpreting incoming data. While the coronavirus pandemic is unprecedented in recent history, in terms of absolute size and global impact, regional disasters can provide at least rough precedents. Unlike even the most severe hurricanes, the coronavirus epidemic is not a quickly passing disaster, and there remains some uncertainty about how quickly it will abate. Going forward, much incoming economic data will likely be unprecedented at the national level. But using Hurricane Katrina as a benchmark may help a bit in interpreting these figures.
 Jason Bram is a research officer in the Federal Reserve Bank of New York’s Research and Statistics Group.
 Richard Deitz is an assistant vice president in the Bank’s Research and Statistics Group.
How to cite this post:
Jason Bram and Richard Deitz, “The Coronavirus Shock Looks More like a Natural Disaster than a Cyclical Downturn,” Federal Reserve Bank of New York Liberty Street Economics, April 10, 2020, https://libertystreeteconomics.newyorkfed.org/2020/04/the-coronavirus-shock-looks-more-like-a-natural-disaster-than-a-cyclical-downturn.html.
Disclaimer
The views expressed in this post are those of the authors and do not necessarily reflect the position of the Federal Reserve Bank of New York or the Federal Reserve System. Any errors or omissions are the responsibility of the authors.


 RSS Feed
 Follow Liberty Street Economics
Fred: Thank you for your comments. The effect of this pandemic on labor force participation—both in terms of magnitude and persistence—is clearly an open question. As you suggest, it may be a negative effect (as in #1 and #3 above) or a positive effect (as in #2 above). At any rate, if this does end up discouraging some people out of the workforce, that might adversely affect the level of employment, but it would probably have a downward effect on the unemployment rate (and an upward effect on wages). Only time will tell. ——————— Phil: Thanks for your comment. Your stool comparison is an interesting one. On the other hand, there may well be **more** impetus to rebuild this time, because migrating to an unaffected place (like Houston after Katrina) is simply not an option. To illustrate this, there was a spike of about 150,000 in Texas’ population in 2006—75,000 in Harris County (Houston) alone—which appears to reflect outmigration from Louisiana. This is unlikely to happen this time, at least to anywhere near the same extent. ——————— Buddy: Thanks for your comment. This is an excellent point. It is true that New Orleans was hit much harder than the rest of the state, especially in terms of flooding, which was the major problem. However, jobless claims—the only really solid economic series with recent information on COVID19—is only available at the state level. It is true that the New Orleans metro saw a steeper percentage job loss, and took even longer to come back. However, there was a good deal of variation across Louisiana, and there is likely to be a good deal of variation during this pandemic across the U.S. At any rate, while it is unclear if Louisiana or New Orleans is the better comparison, that should become clearer in the weeks ahead as we get more regional economic data. Our main point, though, is that comparisons to these types of natural disasters are more informative than comparisons to the 2008-09 recession.
How do you square the data NO metro area data with state-level data? Do they not tell two different stories? NO economy and employment faired far worse than the state. What lessons can be learned from that diffference and how do they apply to the current global (not just national) shock?
I enjoyed reading the original blog post. It helps to add to the mosaic. I struggle with the Katrina comparison. As an analogy, if the US economy is a stool with 50 some legs(states) and Katrina takes out one of those legs the stool does not suffer much loss of stability and we can rebuild the missing leg because the other legs are strong. But if the Corona Hurricane takes out all 50 some legs of the stool, we don’t have a leg to stand on, which makes rebuilding problematic. The good news is we had a solid stool 8 weeks ago…
Bram & Deitz say, “Such an exodus cannot occur as easily in this case, since the disaster is affecting the entire country.” I wonder if that’s true. Particularly, if people leave the labor-force, that would give us effective exodus. It’s hard to guess whether that will occur or not. For examples: (1) If many women, forced to stay home with their children, discover that they love their children and like homemaking better than they like battling office politics and unsnarling bureaucratic snafu’s, then they might opt to not go back (if they have that option). But (2) Many people, forced to stay home with their families, may discover that they don’t really like their families, and this could all be followed by a spike in divorces — which largely removes the option of staying home. Or (an indecisive factor) (3) Will there be a spike in births 9 months after we’re all forced to stay inside together? (With consequent effects on staying home.) Whether this happens may depend on whether couples see the event as temporary or more long lasting. The evidence from weather events (temporary) is more births: The evidence from previous recessions (longer lasting) is fewer births.