


Many of the actions taken by the Federal Reserve during the COVID-19 pandemic are intended to address a deterioration of market functioning. The Federal Open Market Committee (FOMC) announced purchases of Treasury securities and agency mortgage-backed securities (MBS), in particular, “to support the smooth functioning of markets” in those securities. Last month, we showed in this post how one metric of functioning for the Treasury market, market illiquidity, jumped to unusually high levels in March amid massive uncertainty about the economic effects of the pandemic. In this post, we extend our analysis through April and zero in on early 2020 in particular to better understand how the Fed’s actions evolved in relation to day-to-day market developments.
Yields Drift Down in Early 2020
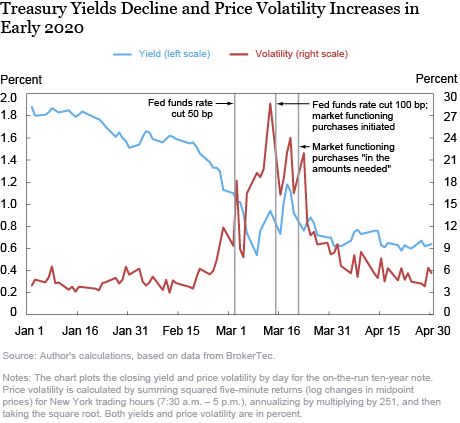
Treasury yields declined at a modest pace in January and through most of February, with the ten-year yield declining almost 60 basis points (from 1.92 percent to 1.34 percent) between December 31, 2019, and February 26 (see chart below). The S&P 500 equity index was generally increasing over this period, and financial market volatility was modest. The World Health Organization had been informed of the COVID-19 outbreak on December 31, but the first reported case in the United States did not come until January 21, and there were only fifteen confirmed U.S. cases as of February 23. Concern about the effects of the pandemic increased more notably in late February, with volatility rising, yields declining more steeply, and the S&P 500 dropping 3 percent or more on February 24, 25, and 27.
Growing Economic Concerns Send Yields Plunging
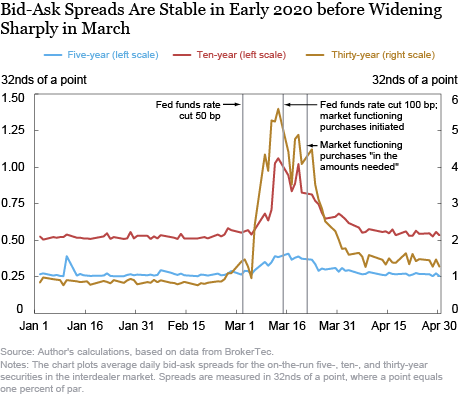
Increased concerns about the effects of the pandemic drove Treasury yields sharply lower between February 26 and March 9, with the ten-year yield plunging nearly 80 basis points from 1.34 percent to a record low of 0.55 percent. Volatility increased sharply as well and the S&P 500 fell 7.6 percent on March 9, triggering a circuit breaker that temporarily halted trading. Treasury liquidity, which had shown little signs of stress through late February, started to deteriorate, most notably on Friday, March 6, and Monday, March 9, as illustrated by widening bid-ask spreads (see next chart).
The Federal Reserve’s actions in response to the pandemic began over this period, with the FOMC cutting the federal funds target rate 50 basis points on March 3 in light of the risks to economic activity. The Fed also increased the sizes of its repo operations, starting March 9, and later lengthened the operation terms, to support the smooth functioning of funding markets.
Yields Rebound in Reported Margin Spiral
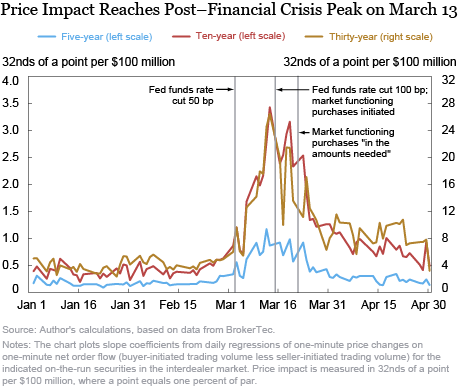
After sharply falling, yields abruptly reversed, with the ten-year yield quickly rising 65 basis points (from 0.55 percent to 1.20 percent) between March 9 and March 18. Treasury volatility also rose higher, peaking on March 13, and the S&P 500 declined, on net, amid unusually high equity volatility. In addition, Treasury liquidity deteriorated, with bid-ask spreads (shown above) and price impact (shown below) reaching their highest levels since the 2007-09 financial crisis, mostly on March 13. There were also pricing dislocations across the cash and futures markets, suggesting a breakdown of arbitrage relationships, as discussed in this paper.
Market analysts point to the unwinding of relative value trades as a contributing factor to the rising yields and high volatility in longer-term Treasury securities. Leveraged investors that bought Treasury securities in the cash market and hedged the interest rate risk with futures contracts reportedly started unwinding these positions as futures prices rose, causing both volatility and margins to increase and resulting in a classic margin spiral. Another factor was the record selling of Treasury notes and bonds by foreign investors, including foreign central banks. Dealers accommodated some of the cash market sales but were unable to do more because of bloated inventories, balance sheet constraints, and internal risk limits amid the high volatility (see this speech). Some trading firms stepped back from the market amid the volatility, further reducing liquidity.
In response to the worsening economic outlook, the FOMC lowered the federal funds target rate a further 100 basis points on March 15 in a rare Sunday announcement. The FOMC announced at the same time that it would increase its holdings of Treasury securities by at least $500 billion and its holdings of agency MBS by at least $200 billion to support market functioning and hence the flow of credit to households and businesses. As noted, illiquidity was generally at its worst on the trading day preceding this announcement (March 13) and hence improved from this point on. On March 17, the Federal Reserve announced that it would restart the Primary Dealer Credit Facility “to support smooth market functioning” by providing funding to primary dealers, which are market makers for Treasury and other securities, as explained in this post.
Liquidity Improves amid Massive Fed Purchases
After reaching a local peak on March 18, yields declined sharply again, with the ten-year yield falling more than 50 basis points (from 1.20 percent to 0.67 percent) by March 27. Volatility declined sharply over this period (especially after March 23), bid-ask spreads narrowed, price impact declined, and order book depth, which had bottomed out March 12 or 13 (depending on the security) began to recover (see next chart). Equity markets remained volatile, with the S&P 500 rising 6 percent, on net, over this period.

This period saw the FOMC announce, on March 23, that it would continue to purchase Treasury securities and agency MBS “in the amounts needed” to support market functioning and the effective transmission of monetary policy. Over the two-week period starting March 19, the Federal Reserve’s Treasury purchases averaged $72 billion per day (see next chart). The market remained highly volatile and illiquid in the hours after this morning announcement, but volatility and illiquidity subsequently declined from their unusually high levels on March 24 and thereafter, according to most measures for most securities.

Market Calms as Fed Purchases Continue
Yields were relatively stable in the March 27 to April 30 period, with the ten-year yield largely unchanged, on net, and the standard deviation of daily ten-year yield changes dropping to 5 basis points, as compared with 16 basis points over the February 26 to March 27 period. Liquidity measures continued to improve as well. As of late April, price impact and order book depth had not yet returned to the levels seen in January and early February, but were comparable to levels observed amid the volatility of late summer and early fall 2019. Equity market volatility also declined sharply over this period and the S&P 500 rose nearly 15 percent.
The Federal Reserve initiated further actions to improve the functioning of the Treasury market in late March and early April. On March 31, the Fed announced the launch of a new facility (the FIMA Repo Facility) to allow foreign central banks to raise U.S. dollars against their holdings of U.S. Treasury securities at the Fed, reducing their incentive to sell U.S. Treasury securities in the open market. The next day, the Fed announced a temporary change to its supplementary leverage ratio rule “to ease strains in the Treasury market resulting from the coronavirus” by mitigating the effects of regulatory restrictions that might constrain banking organizations’ ability to serve as financial intermediaries.
On-the-Run vs. Off-the-Run Considerations
Note that the evidence presented here likely understates the extent of Treasury market illiquidity in early 2020. The preceding analysis concerns the most liquid part of the market—the electronic interdealer broker (IDB) market for on-the-run notes and bonds. Press reports suggest that liquidity worsened especially in more aged, off-the-run securities, which trade through “voice” IDBs and in the dealer-to-customer market. Federal Reserve purchases have been concentrated in these off-the-run securities, as described in these FAQs.
Looking Forward
Treasury market liquidity improved steadily after mid-March, with the Federal Reserve’s security purchases scaled back accordingly. But the economy is still weathering the effects of the pandemic, with consequential information continuing to arrive at a rapid rate. Thus, it is no surprise that the market remains somewhat less liquid than in early 2020, albeit at a level of liquidity similar to that seen during volatile (though non-crisis) times in 2019. How market behavior evolves will remain an ongoing focus going forward.

Michael Fleming is a vice president in the Federal Reserve Bank of New York’s Research and Statistics Group.
How to cite this post:
Michael Fleming, “Treasury Market Liquidity and the Federal Reserve during the COVID-19 Pandemic,” Federal Reserve Bank of New York Liberty Street Economics, May 29, 2020, https://libertystreeteconomics.newyorkfed.org/2020/05/treasury-market-liquidity-and-the-federal-reserve-during-the-covid-19-pandemic.html.
Disclaimer
The views expressed in this post are those of the author and do not necessarily reflect the position of the Federal Reserve Bank of New York or the Federal Reserve System. Any errors or omissions are the responsibility of the author.
 RSS Feed
 Follow Liberty Street Economics
Thanks for the professional analysis.This is very interesting and encouraging information. Good realistic optimism.
Amazing report; the considerations higlighted were really helpful to fully undestand the the constraints in liquidity in the treasuries & funding markets