In a recent Liberty Street Economics post, we showed that the newly reintroduced 20-year bond trades less than other on-the-run Treasury securities and has similar liquidity to that of the more interest‑rate‑sensitive 30-year bond. Is it common for newly introduced securities to trade less and with higher transaction costs, and how does security trading behavior change over time? In this post, we look back at how liquidity evolved for earlier reintroductions of Treasury securities so as to gain insight into how liquidity might evolve for the new 20-year bond.
New 20-Year Bond Trades Less than Other Securities
In May 2020, the Treasury Department reintroduced the 20-year bond, which it had last sold in 1986. The new 20-year bond trades less than other on-the-run Treasury securities, with daily trading volume on the BrokerTec platform in late May averaging $2.4 billion, versus $30.8 billion for the 10-year note and $10.1 billion for the 30-year bond. Liquidity of the 20-year bond is comparable to that of the 30-year bond, but might be expected to be somewhat better because of its shorter tenor and hence lower price sensitivity to interest rate changes.
Is the 20-Year Bond Atypical?
Is the 20-year bond atypical or is it common for new securities to trade less and with higher transaction costs when they’re introduced (or reintroduced), only to become more liquid later? Why might such a pattern exist? Some market participants may be waiting to see how trading and liquidity conditions evolve, and for more data on such conditions to become available, before starting to trade the security. Moreover, as time passes, and additional issues are sold in the new security’s sector, opportunities for relative-value trading increase, which should promote liquidity. Scheduled reopenings also result in larger issue sizes over time, and larger issues are more liquid.
To assess this issue, we look at the performance of other securities that have been reintroduced, namely the 7-year note in February 2009, the 3-year note in November 2008, and the 30-year bond in February 2006. We examine these securities’ behavior not only at reintroduction, but also in the subsequent months and years. We measure performance relative to the 2-, 5-, and 10-year notes so as to control for variation in the market’s overall behavior and isolate, to the extent possible, how the passage of time affects the evolution of activity and liquidity.
As in earlier posts, our analysis is based on data from BrokerTec, an electronic trading platform used by dealers and principal trading firms. BrokerTec intermediates trading in the on-the-run, or most recently auctioned, notes and bonds, in particular. The on-the-run securities are the primary instruments of price discovery and interest rate risk management in the market, and account for about two-thirds of overall trading volume. Our analysis tracks activity and liquidity over time in such securities.
Trading Activity of New Securities Increases over Time
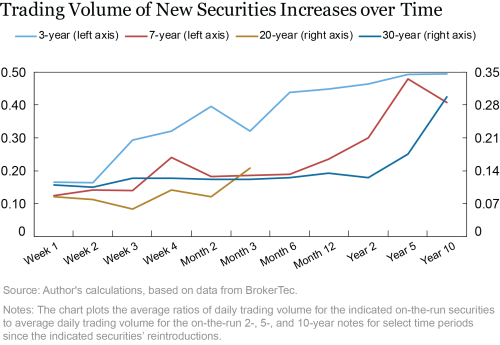
We first examine trading volume in the reintroduced securities. We do this for select intervals from the first week through the tenth year following the auction of each new security. To control for variation in the overall level of trading, we calculate the ratio of trading volume in the reintroduced on-the-run security to the average contemporaneous trading volume of on-the-run 2-, 5-, and 10-year notes.
The upward sloping lines in the chart below indicate that trading activity in reintroduced securities tends to increase over time relative to other securities. For example, in its first week, the 7-year note’s trading volume was only 12 percent of the average trading volume of the 2‑, 5‑, and 10‑year, but this ratio had climbed to 41 percent by the note’s tenth year. The analogous ratio for the 30-year bond’s first week was 11 percent, but a much higher 30 percent for the bond’s tenth year. The ratio for the 20‑year bond was also 8 percent in its first week, but rose to 15 percent in month 3 (which is based on only eight trading days in late July for the 20‑year bond).
New Securities Become More Liquid over Time
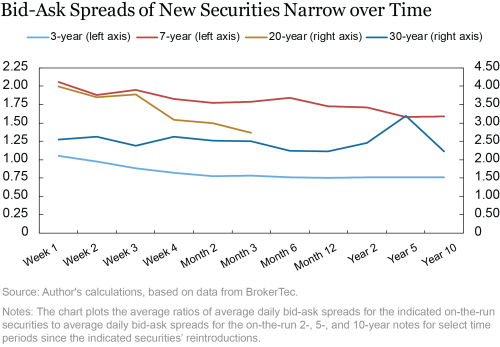
A similar analysis reveals improving liquidity over time. Bid-ask spreads thus tend to narrow, pointing to lower trading costs, as shown in the next chart. The 7-year spread was more than twice as wide as the average of the 2-, 5-, and 10-year spreads in its first week, but just over 1½ times as wide in its tenth year. The 20-year spread was four times as wide as the average of the 2-, 5-, and 10-year notes in its first week, but this quickly narrowed to roughly three times as wide by its fourth week. Because longer tenor securities are more price sensitive to rate changes and hence generally less liquid, this ratio could be expected to remain above one, even in the long run.
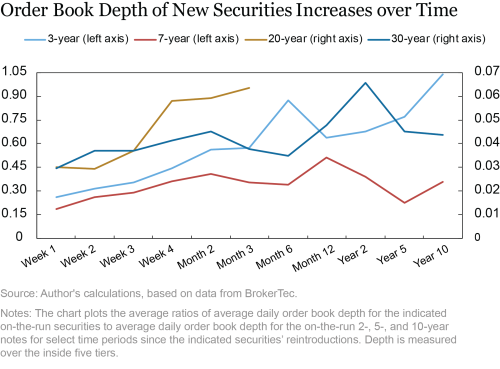
Order book depth similarly points to improved liquidity over time, as shown by the upward trending lines in the chart below. Improved liquidity is notable for the 3-year note for which depth was 26 percent of the average of 2-, 5-, and 10-year depth in its first week after reintroduction, but just over 100 percent in its tenth year. Depth for the 20-year bond has improved notably as well, doubling from 3 percent of average 2-, 5-, and 10-year depth in its first week, to nearly 6 percent by its fourth week.
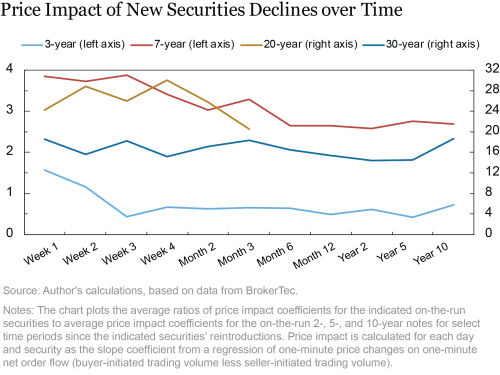
Lastly, price impact coefficients, which measure how much prices tend to rise (decline) for a given quantity bought (sold), tend to decline over time, suggesting improved liquidity, as shown in the next chart. The 7-year note thus had a price impact coefficient nearly four times the average of the 2-, 5-, and 10-year notes in its first week, but only about 2 ½ times by its sixth month. The analogous first week ratio for the 20-year bond was 24; the ratio rose to 30 in the bond’s fourth week, before falling to 21 in the bond’s third month.
Liquidity of 20-Year Bond Improving over Time
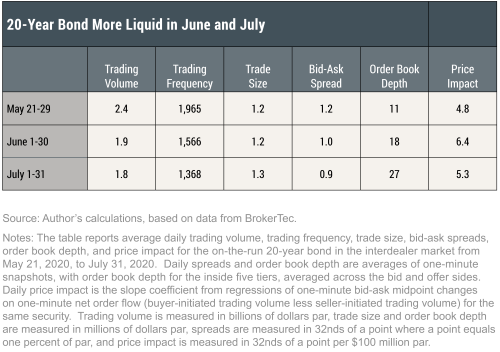
The preceding analysis suggests that the 20-year bond’s liquidity improved over its first few months. Measures of absolute liquidity, reported in the table below, are consistent with this. In particular, the bid‑ask spread and depth improved notably in June and July (price impact worsened in June, but then improved in July). The Treasury Department’s scheduled reopenings of the bond, in which it auctioned off an additional $34 billion (half on June 17, half on July 22) of the issue first sold in May, may help explain the improved liquidity.
What’s in Store for the 20-Year Bond?
Past performance of other reintroduced securities may not be indicative of future results for the 20-year bond. One reason is that 20-year issuance was suspended for over twenty-four years, versus just under sixteen years for the 7-year note, four and a half years for the 30-year bond, and only one and a half years for the 3-year note. Market participants’ may initially be less comfortable trading reintroduced securities for which the length of the issuance suspension has been long. Algorithmic traders, in particular, need data to develop their trading strategies, and account for a greater share of trading volume than in the past. As participants gain experience with the bond, and trading data become increasingly available, the bond’s liquidity may improve more than the preceding analysis suggests.
There are still other reasons the 20-year bond may follow its own path. Market participants expected the 20-year bond to be popular with liability driven investors, such as pension funds and insurance companies, which tend to trade less frequently than other investors. Moreover, to the extent investors buy securities directly at auction, less secondary trading is needed. The 20-year sector is also one with little floating supply, which may cause the bonds to be snapped up by buy-and-hold investors and thereby trade less. How the 20-year bond’s liquidity evolves will be a continued area of interest.

Michael Fleming is a vice president in the Federal Reserve Bank of New York’s Research and Statistics Group.
How to cite this post:
Michael Fleming, “How Does the Liquidity of New Treasury Securities Evolve?,” Federal Reserve Bank of New York Liberty Street Economics, August 26, 2020, https://libertystreeteconomics.newyorkfed.org/2020/08/how-does-the-liquidity-of-new-treasury-securities-evolve.html.
Disclaimer
The views expressed in this post are those of the author and do not necessarily reflect the position of the Federal Reserve Bank of New York or the Federal Reserve System. Any errors or omissions are the responsibility of the author.


 RSS Feed
 Follow Liberty Street Economics
Very interesting article & useful to capture the liquidity data of long term tenors
Thank you for your comment. Please see the following paper, which provides such an analysis for both the cash and futures markets: “The Liquidity Hierarchy in the US Treasury Cash and Futures Market,” Lee Baker, Lihong McPhail, and Bruce Tuckman. The Journal of Fixed Income Summer 2020, 30 (1) 90-99; DOI: https://doi.org/10.3905/jfi.2020.1.091 https://jfi.pm-research.com/content/30/1/90 https://www.cftc.gov/sites/default/files/2018-11/Liquidity%20Hierarchy%20in%20Tsy%20Mkt%20v4_ada.pdf
Do you have a straight analysis of the average risk transfer per day (or week) over time in each of the currents? So a graph with time as x axis, DV01 of risk transfer as y axis, and a line for current, 2,3,5,etc. My priors would be that the 5s and 10s would be continuously at the top of the chart, old 30s would be next, and the rest would be spread out well below.