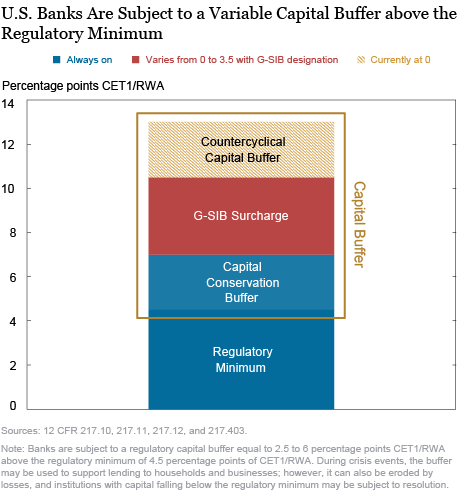
Editor’s note: Since this post was first published, we have corrected a description accompanying the Variable Capital Buffer graphic — Currently, with a countercyclical capital buffer set to 0, the combined minimum and buffer CET1 requirements range from 7 percent to 10.5 percent. (October 6:10 p.m.)
By many measures the U.S. banking industry entered 2020 in good health. But the widespread outbreak of the COVID-19 virus and the associated economic disruptions have caused unemployment to skyrocket and many businesses to suspend or significantly reduce operations. In this post, we consider the implications of the pandemic for the stability of the banking sector, including the potential impact of dividend suspensions on bank capital ratios and the use of banks’ regulatory capital buffers.
Projecting Bank Capital
Before we can consider how regulatory policy can bolster the ability of banks to lend through the crisis, we need projections that capture the potential outcomes for banks. The Federal Reserve Bank of Minneapolis and a Hutchins Center working paper considered the effect of severe scenarios on bank capital. Most recently, the Federal Reserve released sensitivity analyses to capture the current crisis in its annual disclosure of stress test results.
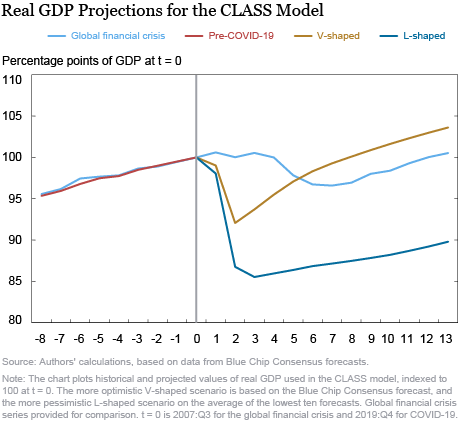
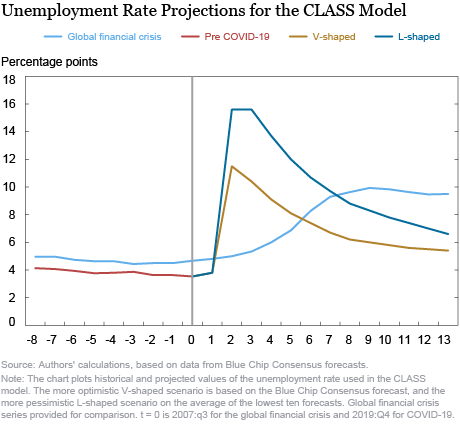
We have conducted our own analysis to understand the impact of macroeconomic scenarios on bank performance. We considered two scenarios that cover distinct possibilities for the course of the outbreak. The first is a “V-shaped” scenario, in which economic activity plunges sharply in the second quarter of 2020 but rebounds quickly in the second half of the year. The second is an “L-shaped” scenario in which economic activity plunges more deeply than in the V-shaped scenario and recovers very slowly over the next three years.The scenarios use the fourth quarter of 2019 as a jumping-off point, so do not incorporate actual economic developments during the first half of 2020. Instead, they are intended to span a range from moderate to significant negative pandemic-related outcomes for the economy as the basis of our analysis. Scenario variables include real GDP, unemployment, stock prices, residential and commercial real estate prices, and credit spreads. The charts below shows the path of real GDP and the unemployment rate under the two scenarios.
We then use these scenarios to project bank profitability and capital. To do so we use the Capital and Loss Assessment under Stress Scenarios, or CLASS, model that is a simplified capital stress test model based on publicly available regulatory reports (FR Y-9C) data. The model uses the historical relationship between components of net income and macroeconomic variables such as real GDP growth, the unemployment rate, interest rates, stock prices, real estate prices, and credit spreads. The last historical date for our analysis is the fourth quarter of 2019 and the stress test horizon is the nine quarters starting in the first quarter of 2020 and ending in the first quarter of 2022.
How Do Dividends Impact Capital Ratios?
The extent of the drop in capital depends on the assumptions we make about shareholder payouts. Although the details of the transactions differ, dividend payments and share repurchases reduce equity capital on a dollar-for-dollar basis. In light of the COVID-19 outbreak, many large banks voluntarily suspended share repurchases in mid-March, but nearly all have continued to make dividend payments. For the third quarter of 2020, the Federal Reserve is requiring large banks to preserve capital by suspending share repurchases, capping dividend payments, and allowing dividends according to a formula based on recent income.
In our projections, we assume that banks maintain repurchase suspensions throughout the projection period (currently the Federal Reserve has restricted repurchases only for the third quarter of 2020). For dividends, we examine two alternatives: banks maintain dividends at their fourth quarter of 2019 levels or banks set dividends to zero starting in the first quarter of 2020. Banks paid dividends during the first and second quarters, and the Federal Reserve has limited dividends only to the average of the latest twelve months of net income. Thus, both of our assumptions are counterfactual but they enable us to generate an upper bound on the impact of dividends on capital ratios.
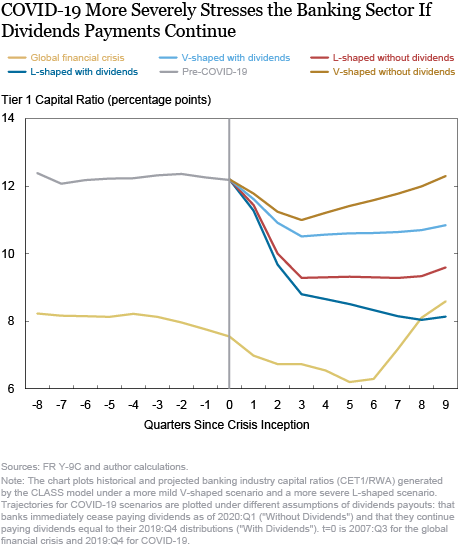
Capital ratios—defined as the ratio of common tier 1 equity (CET1) to risk-weighted assets (RWA)—drop sharply under both the V-shaped and L-shaped scenarios, with the decline being both larger and more persistent under the more severe L-shaped scenario, as shown in the chart below. The industry-average CET1 ratio falls from 12.2 percent in the fourth quarter of 2019 to a minimum of 10.5 percent in the V-shaped scenario and to 8.0 percent in the L-shaped scenario when we assume that banks continue to pay dividends, amounting to drops of 170 and 420 basis points, respectively. The ratio reaches its minimum level and begins to increase relatively quickly in the V-shaped scenario but continues to fall throughout most of the stress test horizon in the L-shaped scenario, recovering only toward the very end of the scenario.
The chart also shows how much dividends matter. The red and gold lines in the chart show the path of the CET1 ratio when we assume that banks suspend dividends during the stress test horizon. In both scenarios, the drop in the CET1 ratio is more muted and the recovery more pronounced than when dividends are paid. By the end of the stress test horizon, both of the projected CET1 ratios are 150 basis points higher when we assume that banks suspend their dividends rather than continue to distribute capital to shareholders.
Using the Buffer
Banks’ regulatory capital requirements have two components: a minimum threshold and a series of “buffers” on top of this minimum. Banks with capital ratios falling below the minimum threshold could be subject to resolution. Banks with capital ratios that are in the buffer (that is, above the minimum but below the minimum plus the buffer amount) face increasingly stringent restrictions on dividends, share repurchases, and discretionary compensation the closer capital gets to the minimum threshold. For CET1 ratios, the minimum is 4.5 percent while the buffer consists of up to three components: an “always-on” capital conservation buffer of 2.5 percent, a time-varying countercyclical capital buffer that can range between 0.0 percent and 2.5 percent depending on financial and economic conditions, and, for the largest and most complex banking companies, a G-SIB surcharge of up to 3.5 percent. Currently, with a countercyclical capital buffer set to 0, the combined minimum and buffer CET1 requirements range from 7 percent to 10.5 percent. Typically, banks endeavor to maintain capital ratios above the minimum plus buffer level to avoid restrictions on capital distributions and compensation, as well as supervisory scrutiny.
Since the onset of the COVID-19 pandemic, supervisors have encouraged banks to allow their capital ratios to drop into the buffer to enable additional lending to support consumers and businesses and thus the broader economy. On March 17, the three federal banking regulators released a statement that they support “banking organizations that choose to use their capital and liquidity buffers to lend and undertake other supportive actions in a safe and sound manner.” The idea is that banks would reduce their buffers due to expansion of the denominator of the capital ratios—risk-weighted assets, in the case of the CET1 ratio—reflecting the increase in lending. Since the capital ratios of most banks are well in excess of the minimum CET1 plus buffer threshold, expanding assets sufficiently would imply a very substantial increase in lending.
However, as we’ve shown, banks could face very substantial losses due to the COVID-19 outbreak. These losses imply a reduction in common tier 1 equity, the numerator of the capital ratio, and reductions of the ratios themselves that could limit banks’ ability to expand lending, even if they were willing to dip into their buffers.
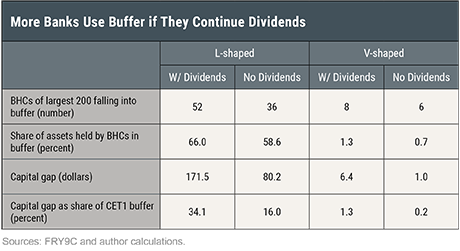
We use our CLASS results to generate a rough estimate of how much their ability to expand lending could be reduced due to COVID-19-related losses. To do this, for each of the scenarios, we
- identify those banks whose CET1 ratios fall into the buffer,
- calculate the dollar amount of the buffer shortfall (that is, the amount of CET1 needed for the bank’s CET1 ratio under stress to just equal the minimum plus buffer threshold),
- sum these buffer shortfalls to create an aggregate “capital gap,” and
- express the capital gap as a share of the total amount of CET1 buffer in the banking industry (that is, the sum of the capital conservation buffer and GSIB surcharges for all banks).
This calculation gives us the share of the CET1 buffer that would be “used” by reductions in the numerator of the CET1 ratio.
As shown in the table below, the amount of buffer used depends on the severity of the scenario and whether banks are assumed to continue their dividend payments. When banks are assumed to suspend their dividends, the capital gap is just 0.2 percent of the overall buffer in the optimistic V-shaped scenario, but 16 percent in the L-shaped scenario. Once again, the impact of dividend payments is striking. Under the more pessimistic L-shaped scenario, the capital gap represents a substantial 34.1 percent of the industry CET1 buffer when banks are assumed to continue their dividends payments, more than double the amount when dividends are suspended.
Summing Up
The ability of banks to support lending to consumers and businesses will be affected by the extent of losses they face and the amount of capital they have after absorbing those losses. Our CLASS model projections suggest that dividends are an important factor in determining whether the U.S. banking industry would have sufficient capacity to absorb losses and expand lending. In particular, when we assume banks suspend dividend payments, we find that they are less prone to meaningfully reduce their capital buffers and thus have more room to increase lending. This is true under both optimistic and pessimistic assumptions about the path of the economy during the COVID -19 outbreak.
Madeline Finnegan is a former senior research analyst in the Federal Reserve Bank of New York’s Research and Statistics Group.

Sarah Ngo Hamerling is a senior research analyst in the Bank’s Research and Statistics Group.

Beverly Hirtle is an executive vice president and the director of research at the Federal Reserve Bank of New York.

Anna Kovner is a policy leader for financial stability in the Federal Reserve Bank of New York’s Research and Statistics Group.

Stephan Luck is an economist in the Bank’s Research and Statistics Group.

Matthew Plosser is an officer in the Bank’s Research and Statistics Group.
How to cite this post:
Madeline Finnegan, Sarah Ngo Hamerling, Beverly Hirtle, Anna Kovner, Stephan Luck, and Matthew Plosser, “The Banking Industry and COVID-19:Lifeline or Life Support?,” Federal Reserve Bank of New York Liberty Street Economics, October 5, 2020, https://libertystreeteconomics.newyorkfed.org/2020/10/the-banking-industry-and-covid-19-lifeline-or-life-support.html.
Disclaimer
The views expressed in this post are those of the authors and do not necessarily reflect the position of the Federal Reserve Bank of New York or the Federal Reserve System. Any errors or omissions are the responsibility of the authors.


 RSS Feed
 Follow Liberty Street Economics