Today, the New York Fed’s Center for Microeconomic Data reported that total household debt balances increased slightly in the third quarter of 2020, according to the latest Quarterly Report on Household Debt and Credit. This increase marked a reversal from the modest decline in the second quarter of 2020, a downturn driven by a sharp contraction in credit card balances. In the third quarter, credit card balances declined again, even as consumer spending recovered somewhat; meanwhile, mortgage originations came in at a robust $1.049 trillion, the highest level since 2003. Many of the efforts to stabilize the economy in response to the COVID-19 crisis have focused on consumer balance sheets, both through direct cash transfers and through forbearances on federally backed debts. Here, we examine the uptake of forbearances on mortgage and auto loans and its impact on their delinquency status and the borrower’s credit score. This analysis, as well as the Quarterly Report on Household Debt and Credit, is based on anonymized Equifax credit report data.
The moratorium on debt service payments during the pandemic
Forbearance provides borrowers the option to pause or reduce debt service payments during periods of hardship, without borrowers’ risk of being marked delinquent. The CARES Act provided for a six-month moratorium on payments on federally guaranteed mortgages and student loans, and voluntary forbearances were offered by lenders of auto loans and credit cards, encouraged by regulators.
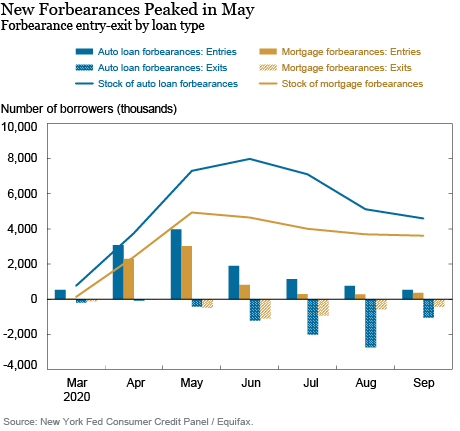
We first take a look at the entry into and out of forbearance, by month and by loan type, shown in the chart below. The solid bars show the number of individuals who went into forbearance on auto loans (blue) and mortgages (gold). Uptake was most brisk during April and May, when the CARES Act was rolled out and when the unemployment rate was rising sharply. In the shaded bars, we show the number of individuals who exited forbearance that month after having previously been in forbearance. A larger number of individuals have exited auto loan forbearance compared to mortgages; probably since the CARES Act provides for a long-duration, six-month (renewable to twelve-month) forbearance on mortgages, while the auto loan forbearance durations may vary by lender and are not legally required. The lines show the number of individuals in forbearance; there were 8 million individuals with an auto loan in forbearance in June, while the mortgage forbearance rate peaked in May, when about 5 million mortgage borrowers were in forbearance (note, however, that auto loans are somewhat more prevalent than mortgages).

Mortgage forbearance rates differed by mortgage type, as not all were covered under the CARES Act and there is substantial variation in the types of borrowers. In September 2020, 4.2 percent of Government Sponsored Entity mortgages (including Fannie Mae and Freddie Mac) were reported as in forbearance in our data, while the rate was 10.6 percent for Ginnie Mae mortgages (including Federal Housing Administration and Veterans Affairs). Among the rest of the first mortgages, including portfolio and non-agency MBS, the rate was 4.2 percent.
What type of borrowers relied on forbearance?
We find common traits among individuals who enrolled in mortgage and auto loan forbearance in the wake of the crisis. First, forborne borrowers were more likely to have lower credit scores in March – in fact, the average credit scores of these borrowers was about 40 points lower than non-forbearance participants for both loan types. The average score among auto borrowers in forbearance was 652, compared to the non-participant average of 693; for mortgage borrowers in forbearance the average score was 708, compared to the non-participant score of 754. Second, mortgage and auto loan forbearance participants had higher balances than those not. For both mortgage and auto loan forbearances, the average remaining balance was approximately 30 percent higher than those who have not taken up forbearances.
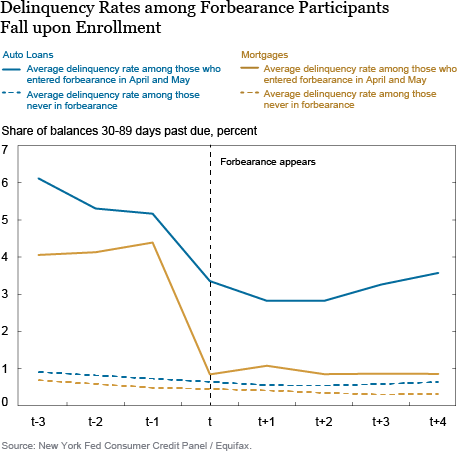
Next, we look at the performance (and credit report treatment) of loans in forbearance, shown below as the share of balances 30-89 days past due for both those who enrolled in forbearance by May 2020 (solid line) and those who have not taken up forbearance since the pandemic began (dotted line). We use the early delinquency rates as a proxy for loans that have transitioned into delinquency, and to not capture those that had already defaulted before the pandemic.

For both auto loans and mortgages, troubled borrowers were far more likely to opt in to forbearances, as evidenced by the higher delinquency rates of participants three months prior to the first forbearance month when we compare the two groups (left hand side of the chart). But most obvious on the chart are the sharp reductions in the share of balances that were 30-89 days past due once the forbearance began. Many lenders have marked forbearance participants who were previously delinquent as current as these borrowers had no payment due for the month. On average, delinquent borrowers whose loans were converted to “current” upon entry into forbearance saw an average 48 point increase in their credit scores (here, Equifax Risk Score 3.0). In contrast, the average credit score of borrowers who were current before the forbearance was unchanged.
The way consumers are weathering this recession has been an important policy discussion, particularly as the cash transfers to households provided by the CARES Act have ended and the forbearances are set to expire. How households will endure the “fiscal cliff” is of significant interest, and we will closely monitor the ability of borrowers to maintain debt payments, especially among borrowers rolling off forbearance as the COVID-19 crisis evolves.

Andrew F. Haughwout is a senior vice president in the Federal Reserve Bank of New York’s Research and Statistics Group.

Donghoon Lee is an officer in the Bank’s Research and Statistics Group.

Joelle Scally is a senior data strategist in the Bank’s Research and Statistics Group.

Wilbert van der Klaauw is a senior vice president in the Bank’s Research and Statistics Group.
How to cite this post:
Andrew F. Haughwout, Donghoon Lee, Joelle Scally, and Wilbert van der Klaauw, “Following Borrowers through Forbearance,” Federal Reserve Bank of New York Liberty Street Economics, November 17, 2020, https://libertystreeteconomics.newyorkfed.org/2020/11/following-borrowers-through-forbearance.html.
Disclaimer
The views expressed in this post are those of the authors and do not necessarily reflect the position of the Federal Reserve Bank of New York or the Federal Reserve System. Any errors or omissions are the responsibility of the authors.


 RSS Feed
 Follow Liberty Street Economics