This is the third post in a series looking to explain the gap in COVID-19 intensity by race and by income. In the first two posts, we have investigated whether comorbidities, uninsurance, hospital resources, and home and transit crowding help explain the income and minority gaps. Here, we continue our investigation by looking at three additional potential channels: the fraction of elderly people, pollution, and social distancing at the beginning of the pandemic in the county. We aim to understand whether these three factors affect overall COVID-19 intensity, whether the income and racial gaps of COVID-19 can be further explained when we additionally include these factors, and whether and to what extent these factors independently account for income and racial gaps in COVID-19 intensity (without controlling for the factors considered in the other posts in this series).
Background
It is intuitive that these three variables should relate to COVID-19 intensity. In the case of the first potential channel, we observe that the elderly are typically more severely affected by COVID-19. However, the fraction of elderly may turn out to have a weaker correlation with COVID-19 because the elderly and their families may take particular precautions to avoid getting the disease. Air pollution, which exacerbates breathing problems, may also make the course of COVID-19 more severe. We measure air pollution by the concentration of nitrogen dioxide.
Turning to social distancing, interpersonal interactions are a primary way through which COVID-19 is spread, with the length and intensity of interactions with infected people affecting the severity of the disease. Promoting social distancing was the main purpose of lockdowns implemented by most states in March and April as the first wave of the pandemic began. We measure social distancing as the fraction of cell phones that remain completely at home and do not move during the day, using aggregated, anonymized cell phone mobility data provided by SafeGraph. However, social distancing and the course of the pandemic have a complex interaction because people tend to socially distance on their own as the pandemic intensifies, leading to a positive rather than a negative association between social distancing and COVID-19 intensity. Therefore, we analyze the relationship between cumulative COVID-19 case counts and social distancing at the time the pandemic began in a county, specifically, in the three weeks before the tenth reported COVID-19 case. While social distancing at the beginning of an outbreak of the pandemic in a county likely critically affects the subsequent course of infection in that county, it is likely that so early in the course of the outbreak, individuals are not yet anticipating how large the outbreak in their county is going to be and are not taking precautions accordingly.
Age, Pollution, Social Distancing, and the COVID-19 Race and Income Gaps
In order to have explanatory power for the income and minority COVID-19 gaps, these three measures need to be disproportionately high or low in counties where minorities are a majority, or counties that are low-income. Considering the correlations between age composition, pollution, and social distancing with majority-minority (MM) and low-income status across U.S. counties, we see that MM counties have a much lower fraction of the population that is over 60. On the other hand, MM counties have considerably more pollution than do other counties. Finally, MM counties had somewhat less social distancing at the beginning of their COVID-19 outbreaks than did majority-nonminority counties, a fact that is consistent with many minorities being in “essential worker” occupations and needing to commute to work even during lockdowns. Interestingly, the correlations between the three variables and low-income status are the opposite of their correlations with MM status—low-income areas have a higher fraction of the population over 60, a lower level of pollution, and a greater degree of social distancing. An intuition for this pattern is that many low-income areas could be described as majority-nonminority, as rural areas with few young people, and as having low industrial pollution and ease in terms of social distancing.
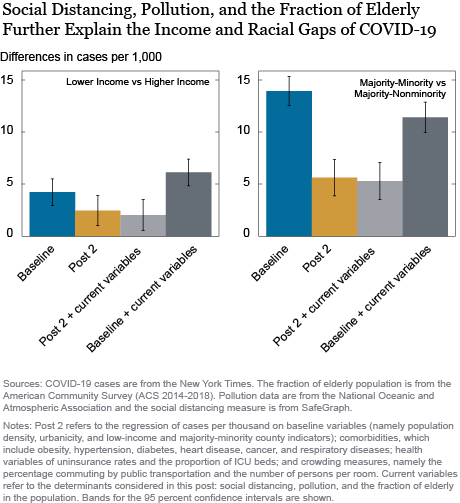
To see to what extent the three factors we discuss explain the racial and income gaps in COVID-19 intensity, we perform multivariate regressions similar to those in the first two posts of this series. In the chart below, we present estimates resulting from regressing cases per thousand on the baseline variables—population density, urbanicity, and the low-income and MM county indicators (in blue); the baseline variables augmented by all the variables we have considered so far in the series (in gold); all the variables considered so far augmented by the three mediating variables we have discussed in this post (in light gray); and the baseline variables and the mediating variables introduced in this post, but not the other variables introduced in the two previous posts (in dark gray).

As we saw in the first two posts in the series, the basic regressions show that COVID-19 cases per thousand were much higher in low-income and MM counties, with the differences being statistically significant. These differences were about 4.2 extra cases per thousand in low-income counties and 14 extra cases in MM counties, as shown in the blue bars above. When the controls for comorbidities, uninsurance, ICU resources, public transit, and home crowding that were discussed in the first and second posts in the series are added, these differentials decline considerably, although both remain significant, depicted in the bars in gold.
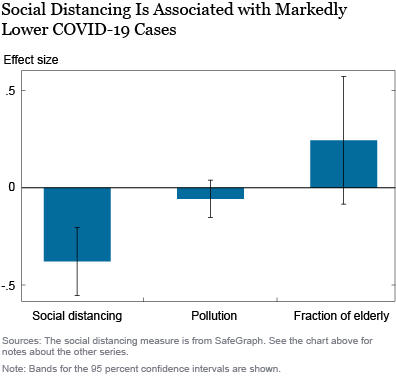
The three mediating variables we consider in this post are added in the bars shown in light gray. We see that while the mediating variables, especially social distancing at the beginning of the local outbreak, appear to have considerable explanatory power for COVID-19 cases (see below), they do not provide much additional information on the sources of the MM and low-income gaps in the intensity of the pandemic after we include the variables considered in the prior posts in this series. The low-income and MM coefficients change little from the gold bars to the light gray bars, as the MM differential for cases remains statistically significant, amounting to about one-third of the original estimate in our first post. In results not reported, we see that the magnitude and significance of the other potential determinants of COVID-19 are very similar in our analysis to what they were in the previous posts.
To assess the contributions of the mediating variables on their own, the bars in dark gray represent regressions in which only the baseline variables and the mediating variables are included. We see that the minority gap is little reduced (and the income gap is actually increased) relative to their values in the baseline regression, and are statistically significantly different from zero. In results not reported here, we have also run regressions where we have introduced each of these three variables separately in our baseline regression. In each case, we find that these inclusions barely affect the economic and statistical significance of the race and income gaps.
Examining the associations between the mediating variables and COVID-19 cases, we find that social distancing at the beginning of a county’s outbreak is strongly and significantly associated with fewer cases per thousand. Specifically, a 10 percentage point increase in the fraction of cell phones remaining completely at home at the beginning of the outbreak is associated with 3.78 fewer cases per thousand in the county. The association between reported cases per thousand and the fraction over 60 is positive (that is, a greater share of elderly people is associated with more cases) while the relationship between reported cases and pollution is negative, but neither association is statistically significant.

Conclusion
We conclude that social distancing has a strong association with COVID-19 intensity even conditional on other determinants of the pandemic, while pollution and age composition do not provide additional explanatory power once other factors are taken into account. None of the mediating variables further explains the low-income and MM gaps in cases after other determinants, such as comorbidities, health facilities, home crowding, public transportation, and population density, have been accounted for. As our analysis is purely descriptive, we cannot rule out that our measures of social distancing, pollution, and the fraction of elderly people are proxying for other characteristics that are prevalent in low-income and MM areas, and that those may be the underlying drivers of COVID-19 in these areas. Nevertheless, our analysis captures how some variables amenable to policy intervention—such as social distancing—might contribute to differences in COVID-19 incidence. In the next post that will wrap up the series, we turn our attention to one final mediating variable of interest—the proportion of essential workers in a county, and see whether that helps in explaining more of the observed COVID-19 gap.
Ruchi Avtar is a senior research analyst in the Federal Reserve Bank of New York’s Research and Statistics Group.

Rajashri Chakrabarti is a senior economist in the Bank’s Research and Statistics Group.
Lindsay Meyerson was an economics student at Columbia University.

Maxim Pinkovskiy is a senior economist in the Bank’s Research and Statistics Group.
How to cite this post:
Ruchi Avtar, Rajashri Chakrabarti, Lindsay Meyerson, and Maxim Pinkovskiy, “Understanding the Racial and Income Gap in COVID-19: Social Distancing, Pollution, and Demographics,” Federal Reserve Bank of New York Liberty Street Economics, January 12, 2021, https://libertystreeteconomics.newyorkfed.org/2021/01/understanding-the-racial-and-income-gap-in-covid-19-social-distancing-pollution-and-demographics.html.
Disclaimer
The views expressed in this post are those of the authors and do not necessarily reflect the position of the Federal Reserve Bank of New York or the Federal Reserve System. Any errors or omissions are the responsibility of the authors.


 RSS Feed
 Follow Liberty Street Economics